Attention Investors! This 2 Bedroom, 1 Bath, 1,272 sq. ft. house is priced to sell. Property updates needed are reflected in the price and the seller is motivated. The furnace and hot water heater are located in the outside basement access to the rear of the property. Call agent(s) with questions.
Pending
Price cut: $55K (11/14)
$45,000
511 E Southern Ave, Springfield, OH 45505
2beds
1,272sqft
Single Family Residence
Built in 1892
5,662 Square Feet Lot
$-- Zestimate®
$35/sqft
$-- HOA
What's special
- 7 days
- 88
- 10
Likely to sell faster than
Zillow last checked:
Listing updated:
Listed by:
Jeannie Fudge 937-322-0352,
Coldwell Banker Heritage,
Mark Kapp 937-322-0352,
Coldwell Banker Heritage
Source: WRIST,MLS#: 1049787
Facts & features
Interior
Bedrooms & bathrooms
- Bedrooms: 2
- Bathrooms: 1
- Full bathrooms: 1
Bedroom 1
- Level: Second
- Area: 182 Square Feet
- Dimensions: 14.00 x 13.00
Bedroom 2
- Level: Second
- Area: 225 Square Feet
- Dimensions: 15.00 x 15.00
Kitchen
- Level: First
- Area: 182 Square Feet
- Dimensions: 14.00 x 13.00
Heating
- Forced Air, Natural Gas
Cooling
- Other
Features
- Flooring: Carpet, Wood
- Basement: Block,Unfinished
- Has fireplace: No
Interior area
- Total structure area: 1,272
- Total interior livable area: 1,272 sqft
Video & virtual tour
Property
Features
- Levels: Two
- Stories: 2
- Patio & porch: Porch
Lot
- Size: 5,662 Square Feet
- Dimensions: 39 x 150
- Features: Residential Lot
Details
- Parcel number: 3400700034422018
- Zoning description: Residential
Construction
Type & style
- Home type: SingleFamily
- Architectural style: Other
- Property subtype: Single Family Residence
Materials
- Asbestos
- Foundation: Other
Condition
- Year built: 1892
Utilities & green energy
- Sewer: Public Sewer
- Water: Supplied Water
- Utilities for property: Natural Gas Connected
Community & HOA
Community
- Subdivision: Mrs
HOA
- Has HOA: No
Location
- Region: Springfield
Financial & listing details
- Price per square foot: $35/sqft
- Tax assessed value: $31,530
- Annual tax amount: $491
- Date on market: 11/14/2026
- Listing terms: Cash
Estimated market value
Not available
Estimated sales range
Not available
$1,304/mo
Price history
| Date | Event | Price |
|---|---|---|
| 11/17/2026 | Pending sale | $45,000$35/sqft |
Source:  WRIST #1049787 Report a problem | ||
| 11/14/2026 | Price change | $45,000-55%$35/sqft |
Source: WRIST #1049787 Report a problem | ||
| 9/12/2026 | Listed for sale | $100,000+1233.3%$79/sqft |
Source: Owner Report a problem | ||
| 4/4/2025 | Listing removed | $1,000$1/sqft |
Source: Zillow Rentals Report a problem | ||
| 3/6/2025 | Listed for rent | $1,000+11.1%$1/sqft |
Source: Zillow Rentals Report a problem | ||
| 12/22/2022 | Listing removed | -- |
Source: Zillow Rentals Report a problem | ||
| 12/8/2022 | Listed for rent | $900$1/sqft |
Source: Zillow Rentals Report a problem | ||
| 10/28/2022 | Listing removed | -- |
Source: Zillow Rental Manager Report a problem | ||
| 9/28/2022 | Listed for rent | $900+2.9%$1/sqft |
Source: Zillow Rental Manager Report a problem | ||
| 8/11/2022 | Listing removed | -- |
Source: Zillow Rental Manager Report a problem | ||
| 7/11/2022 | Listed for rent | $875+45.8%$1/sqft |
Source: Zillow Rental Manager Report a problem | ||
| 3/24/2021 | Listing removed | -- |
Source: Owner Report a problem | ||
| 10/22/2017 | Listing removed | $600 |
Source: Owner Report a problem | ||
| 10/12/2017 | Listed for rent | $600 |
Source: Owner Report a problem | ||
| 6/29/2006 | Sold | $7,500-25%$6/sqft |
Source: Public Record Report a problem | ||
| 2/3/2006 | Sold | $10,000$8/sqft |
Source: Public Record Report a problem | ||
Public tax history
| Year | Property taxes | Tax assessment |
|---|---|---|
| 2025 | $491 +21.6% | $11,040 +38.5% |
| 2024 | $404 +2.6% | $7,970 |
| 2023 | $394 -2.4% | $7,970 |
| 2022 | $403 +11.4% | $7,970 +20.9% |
| 2021 | $362 -0.2% | $6,590 |
| 2020 | $363 -0.2% | $6,590 |
| 2019 | $364 +132.5% | $6,590 +142.3% |
| 2018 | $156 | $2,720 -0.3% |
| 2017 | $156 -0.1% | $2,727 |
| 2016 | $157 +101.3% | $2,727 +2.6% |
| 2015 | $78 | $2,657 |
| 2014 | $78 -49.2% | $2,657 |
| 2013 | $153 -65.5% | $2,657 -40.9% |
| 2012 | $444 +74.7% | $4,494 |
| 2011 | $254 +4.7% | $4,494 |
| 2010 | $243 -6.5% | $4,494 -12% |
| 2009 | $260 +3% | $5,107 |
| 2008 | $252 +1.3% | $5,107 |
| 2007 | $249 -51.2% | $5,107 -47.5% |
| 2006 | $510 +21.1% | $9,724 |
| 2005 | $421 -44.1% | $9,724 +0% |
| 2004 | $753 +12.9% | $9,720 +14.9% |
| 2003 | $667 -0.2% | $8,460 |
| 2002 | $668 +23.1% | $8,460 +21.7% |
| 2000 | $543 | $6,950 |
Find assessor info on the county website
Monthly payment
Est. payment
Payment breakdown
Explore the cost of this home by adjusting the details. Changes won't be saved.Climate risks
Neighborhood: 45505

Similar homes
- $45,0003 bd1 ba1.2k sqft1001 Clifton Ave, Springfield, OH 45505For Sale
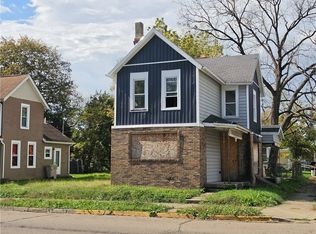
 MLS ID #971474, Raul Etayem, Coldwell Banker Heritage. DABR MLS
- $46,0002 bd1 ba1k sqft546 E Rose St, Springfield, OH 45505For Sale
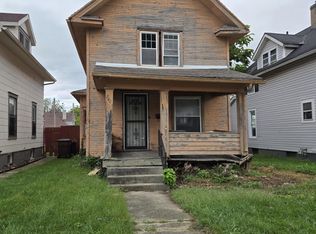
 MLS ID #1048558, KD Nave, Glasshouse Realty Group. WRIST
- $47,0003 bd1 ba1.1k sqft1322 Linden Ave, Springfield, OH 45505For Sale
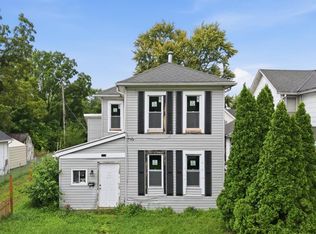 MLS ID #966910, Sam Cooper, Howard Hanna Real Estate Serv. DABR MLS
- $63,0002 bd1 ba1.2k sqft705 York St, Springfield, OH 45505For Sale
 MLS ID #1035301, Alva Fulk, Real Estate II, Inc.. WRIST
- $49,9002 bd1 ba964 sqft293 S Miami Ave, Xenia, OH 45385For SaleMLS ID #972748, Christopher Howard, Real of Ohio. DABR MLS
- $50,0003 bd1 ba1.2k sqft24 Adams St, Jamestown, OH 45335For SaleMLS ID #965092, Amanda Dahlinghaus, Bella Realty Group. DABR MLS
- $25,0002 bd1 ba915 sqft302 Mobile St, Springfield, OH 45503For SaleMLS ID #1047203, Tim Sisler, Coldwell Banker Heritage. WRIST
- $37,5002 bd1 ba980 sqft113 Croskey Blvd, Medway, OH 45341For SaleMLS ID #1047319, Tim Sisler, Coldwell Banker Heritage. WRIST
- $35,0003 bd2 ba700 sqft220 Western Dr, Medway, OH 45341For SaleMLS ID #1047397, Tim Sisler, Coldwell Banker Heritage. WRIST
- $25,0003 bd2 ba980 sqft88 Willowwood Cir, Urbana, OH 43078For SaleMLS ID #1045184, Zachary Graham, Realistar. WRIST
- $26,5002 bd1 ba980 sqft6254 Us Highway 40 Lot 30, Tipp City, OH 45371For SaleMLS ID #965950, Todd Romantini, Coldwell Banker Heritage. DABR MLS
- $65,0003 bd2 ba1.2k sqft3430 Michael Dr, New Carlisle, OH 45344For SaleMLS ID #1041321, Jeff Horne, Coldwell Banker Heritage. WRIST
