beautiful open feel , high ceiling , fresh paint and new floors
For sale by owner
$320,000
519 Pine Way, Ocala, FL 34472
3beds
1,510sqft
SingleFamily
Built in 1989
10,018 Square Feet Lot
$-- Zestimate®
$212/sqft
$-- HOA
What's special
High ceilingFresh paintBeautiful open feelNew floors
What the owner loves about this home
Close to Walmart and Aldi
- 29 days
- 138
- 3
Listed by:
Property Owner (516) 502-5936
Facts & features
Interior
Bedrooms & bathrooms
- Bedrooms: 3
- Bathrooms: 2
- Full bathrooms: 2
Heating
- Heat pump
Features
- Flooring: Carpet
Interior area
- Total interior livable area: 1,510 sqft
Property
Parking
- Total spaces: 6
- Parking features: Garage
Features
- Exterior features: Cement / Concrete
Lot
- Size: 10,018 Square Feet
Details
- Parcel number: 9008002822
Construction
Type & style
- Home type: SingleFamily
Materials
- Foundation: Slab
- Roof: Other
Condition
- New construction: No
- Year built: 1989
Community & HOA
Location
- Region: Ocala
Financial & listing details
- Price per square foot: $212/sqft
- Tax assessed value: $188,663
- Annual tax amount: $1,103
- Date on market: 9/21/2026
Estimated market value
Not available
Estimated sales range
Not available
$1,767/mo
Price history
| Date | Event | Price |
|---|---|---|
| 9/21/2026 | Listed for sale | $320,000-7.2%$212/sqft |
Source: Owner Report a problem | ||
| 5/28/2026 | Listing removed | -- |
Source: Owner Report a problem | ||
| 2/27/2026 | Price change | $345,000+28.7%$228/sqft |
Source: Owner Report a problem | ||
| 2/24/2026 | Listed for sale | $268,000$177/sqft |
Source: Owner Report a problem | ||
Public tax history
| Year | Property taxes | Tax assessment |
|---|---|---|
| 2025 | $1,103 +24.7% | $74,570 +2.9% |
| 2024 | $885 +0.9% | $72,468 +3% |
| 2023 | $876 +1.1% | $70,357 +3% |
| 2022 | $867 -0.8% | $68,308 +3% |
| 2021 | $874 +0.2% | $66,318 +1.4% |
| 2020 | $872 +0.4% | $65,402 +2.3% |
| 2019 | $869 | $63,932 +1.9% |
| 2018 | $869 +4% | $62,740 +2.1% |
| 2017 | $835 +2.7% | $61,450 +2.1% |
| 2016 | $813 | $60,186 +0.7% |
| 2015 | $813 +4.3% | $59,768 +0.8% |
| 2014 | $780 +1.5% | $59,294 +1.5% |
| 2013 | $768 -6.3% | $58,418 -10.2% |
| 2012 | $820 -4.3% | $65,034 -6.5% |
| 2011 | $857 -2.6% | $69,588 -5.4% |
| 2010 | $880 +3.1% | $73,534 +2.7% |
| 2009 | $853 +0.9% | $71,601 +0.1% |
| 2008 | $846 -12.2% | $71,530 +3% |
| 2007 | $964 -4% | $69,447 +2.5% |
| 2006 | $1,003 +5.5% | $67,754 +3% |
| 2005 | $952 | $65,781 +3% |
| 2004 | $952 +6.4% | $63,866 +4.3% |
| 2002 | $894 +16.1% | $61,208 +7.4% |
| 2001 | $771 | $56,980 |
| 2000 | $771 | $56,980 |
Find assessor info on the county website
Monthly payment
Est. payment
Payment breakdown
Explore the cost of this home by adjusting the details. Changes won't be saved.Climate risks
Neighborhood: 34472

Similar homes
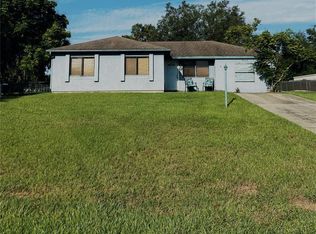
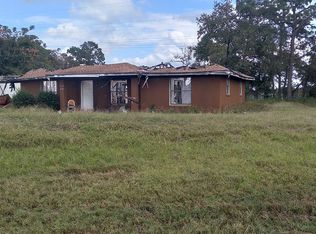
- $285,0003 bd2 ba1.4k sqft321 OAK TRACK LOOP, OCALA, FL 34472For Sale
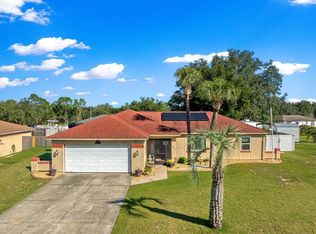
 MLS ID #OM734117, Taylor Rafferty, MARION OAKS REAL ESTATE LLC. Stellar MLS
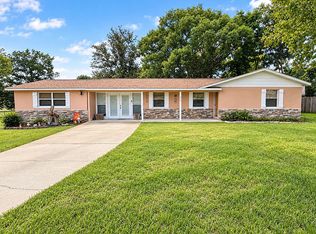
- $270,0003 bd2 ba1.5k sqft471 Lake Rd, Ocala, FL 34472For Sale By Owner
- $315,0003 bd2 ba1.5k sqft523 BAHIA CIRCLE TERRACE, OCALA, FL 34472For Sale
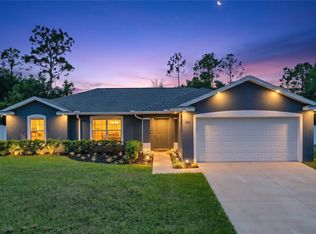 MLS ID #OM732901, Lane White, ASHLAR REALTY. Stellar MLS
- $299,9003 bd2 ba1.9k sqft510 SAPPHIRE LANE, OCALA, FL 34472For Sale
 MLS ID #OM732210, Melissa Lebron, RE/MAX PREMIER REALTY. Stellar MLS
- $296,0003 bd2 ba1.9k sqft555 SILVER COURSE CIRCLE, OCALA, FL 34472For SaleMLS ID #OM724233, Barbara Clarey-Romaine, MAJESTIC OAKS REALTY. Stellar MLS
- $275,0003 bd2 ba1.2k sqft471 SPRING LANE, OCALA, FL 34472For SaleMLS ID #OM733319, Drew Massey, GAILEY ENTERPRISES REAL ESTATE. Stellar MLS
- $350,0003 bd2 ba1.9k sqft129 BAHIA TRACE, OCALA, FL 34472For SaleMLS ID #OM731740, Nicole Alicia Agramonte Toribio, GAILEY ENTERPRISES REAL ESTATE. Stellar MLS
- $294,9003 bd3 ba1.4k sqft24 FIR TRAIL PASS, OCALA, FL 34472For SaleMLS ID #O6435675, Steven Koleno, BEYCOME OF FLORIDA LLC. Stellar MLS
- $275,0003 bd2 ba1.9k sqft568 SILVER COURSE LOOP, OCALA, FL 34472For SaleMLS ID #O6441319, Natalia Carletti, CHARLES RUTENBERG REALTY ORLANDO. Stellar MLS
- $314,0003 bd2 ba1.7k sqft16 SPRING TRAIL, OCALA, FL 34472For SaleMLS ID #OM732592, John Starr, WORTH CLARK REALTY. Stellar MLS
- $299,0003 bd3 ba1.8k sqft199 OAK LANE ROAD, OCALA, FL 34472For SaleMLS ID #OM732799, Michelle Jarvis, PREMIER SOTHEBY'S INTERNATIONA. Stellar MLS
- $209,9003 bd2 ba1.2k sqft9442 BAHIA ROAD, OCALA, FL 34472For SaleMLS ID #R4912169, Isabella Uran, OLLEB PROPERTIES, LLC. Stellar MLS
- $300,0003 bd2 ba1.5k sqft12 BAHIA PASS DR, OCALA, FL 34472New ConstructionMLS ID #OM733929, Emily Bravo, GLOBALWIDE REALTY LLC. Stellar MLS
- $185,0003 bd2 ba1.5k sqft313 BAHIA CIRCLE, OCALA, FL 34472For SaleMLS ID #GC544192, Joyce Dorval, CAMPUS TO COAST REALTY, LLC. Stellar MLS
- $259,9003 bd2 ba2k sqft9441 BAHIA ROAD, OCALA, FL 34472For SaleMLS ID #O6444102, Gladis Arroyave, LA ROSA REALTY CENTRAL FLORIDA LLC. Stellar MLS
- $270,0003 bd2 ba1.5k sqft10 SPRING LAKE RUN, OCALA, FL 34472For SaleMLS ID #OM731031, Stephanie Abbott, LPT REALTY, LLC. Stellar MLS
- $229,9993 bd2 ba1.5k sqft248 BAHIA CIRCLE, OCALA, FL 34472For SaleMLS ID #OM733476, Kelly LaFave, EXP REALTY LLC. Stellar MLS
- $249,9003 bd3 ba1.3k sqft814 OAK Road, Ocala, FL 34472For Sale
 MLS ID #B26080615, Daniel Castaneda, American Realty of PSL LLC. BeachesMLS
- $259,0003 bd2 ba1.6k sqft86 BAHIA TRACE TRAIL, OCALA, FL 34472For SaleMLS ID #OM724651, Dionne Peace, COLDWELL BANKER VANGUARD LIFESTYLE REALTY. Stellar MLS
- $349,9003 bd3 ba2.2k sqft490 WATER ROAD, OCALA, FL 34472For SaleMLS ID #O6375043, Alissa Williams, MAGNOLIA & MAIN REALTY ADVISORS LLC. Stellar MLS
