Opportunity for investor/developer for their best use. Likely a tear down due to structural issues.Seller has conceptual architectural plans for a commercial facility. Home has significant water damage. Bring your vision. Cash/rehab financing only.
For sale
$195,000
5213 Call Pl SE, Washington, DC 20019
3beds
920sqft
Single Family Residence
Built in 1945
4,000 Square Feet Lot
$185,300 Zestimate®
$212/sqft
$-- HOA
What's special
- 52 days
- 449
- 17
Zillow last checked:
Listing updated:
Listed by:
Ayana Douglas 202-459-8741,
Compass
Source: Bright MLS,MLS#: DCDC2285806
Facts & features
Interior
Bedrooms & bathrooms
- Bedrooms: 3
- Bathrooms: 1
- Full bathrooms: 1
- Main level bathrooms: 1
- Main level bedrooms: 3
Basement
- Area: 0
Heating
- Forced Air, Radiator, Natural Gas
Cooling
- Central Air, Natural Gas
Appliances
- Included: Gas Water Heater
Features
- Has basement: No
- Has fireplace: No
Interior area
- Total structure area: 1,840
- Total interior livable area: 920 sqft
- Finished area above ground: 920
- Finished area below ground: 0
Property
Parking
- Total spaces: 2
- Parking features: Driveway
- Uncovered spaces: 2
Accessibility
- Accessibility features: None
Features
- Levels: One
- Stories: 1
- Pool features: None
Lot
- Size: 4,000 Square Feet
- Features: Unknown Soil Type
Details
- Additional structures: Above Grade, Below Grade
- Parcel number: 5312//0039
- Zoning: R-3
- Special conditions: Short Sale
Construction
Type & style
- Home type: SingleFamily
- Architectural style: Ranch/Rambler
- Property subtype: Single Family Residence
Materials
- Brick, Vinyl Siding
- Foundation: Slab
Condition
- New construction: No
- Year built: 1945
Utilities & green energy
- Sewer: Public Sewer
- Water: Public
Community & HOA
Community
- Subdivision: Marshall Heights
HOA
- Has HOA: No
Location
- Region: Washington
Financial & listing details
- Price per square foot: $212/sqft
- Tax assessed value: $143,400
- Annual tax amount: $7,170
- Date on market: 9/30/2026
- Listing agreement: Exclusive Agency
- Ownership: Fee Simple
Estimated market value
$185,300
$174,000 - $195,000
$3,037/mo
Price history
| Date | Event | Price |
|---|---|---|
| 9/30/2026 | Listed for sale | $195,000-34.8%$212/sqft |
Source:  Bright MLS #DCDC2285806 Report a problem | ||
| 6/5/2023 | Listing removed | -- |
Source: Bright MLS #DCDC501300 Report a problem | ||
| 6/14/2021 | Sold | $299,000$325/sqft |
Source: Public Record Report a problem | ||
| 5/7/2021 | Pending sale | $299,000$325/sqft |
Source: Bright MLS #DCDC501300 Report a problem | ||
| 5/3/2021 | Listing removed | $299,000$325/sqft |
Source: Bright MLS #DCDC501300 Report a problem | ||
| 4/7/2021 | Listed for sale | $299,000$325/sqft |
Source: Bright MLS #DCDC501300 Report a problem | ||
| 2/15/2021 | Pending sale | $299,000$325/sqft |
Source: Bright MLS #DCDC501300 Report a problem | ||
| 2/8/2021 | Listing removed | -- |
Source: Bright MLS #DCDC501300 Report a problem | ||
| 1/7/2021 | Pending sale | $299,000-16.7%$325/sqft |
Source: Bright MLS #DCDC501300 Report a problem | ||
| 10/17/2019 | Listing removed | $359,000$390/sqft |
Source: 4J Real Estate, LLC #DCDC437912 Report a problem | ||
| 12/6/2018 | Listed for sale | $359,000+67%$390/sqft |
Source: M Squared Real Estate LLC #DCDC254488 Report a problem | ||
| 10/26/2018 | Sold | $215,000+152.9%$234/sqft |
Source: Public Record Report a problem | ||
| 7/6/2005 | Sold | $85,000$92/sqft |
Source: Public Record Report a problem | ||
Public tax history
| Year | Property taxes | Tax assessment |
|---|---|---|
| 2026 | $16,512 +0.7% | $330,240 +0.7% |
| 2025 | $16,390 +1.4% | $327,790 +1.4% |
| 2024 | $16,157 +2.2% | $323,140 +2.2% |
| 2023 | $15,809 -46.5% | $316,180 +6.9% |
| 2022 | $29,571 +1131.3% | $295,710 +4.7% |
| 2021 | $2,402 +4% | $282,540 +4% |
| 2020 | $2,308 +54.8% | $271,580 +54.8% |
| 2018 | $1,491 +10% | $175,440 +10% |
| 2017 | $1,356 +4.8% | $159,510 +4.8% |
| 2016 | $1,294 +6% | $152,190 +6% |
| 2015 | $1,221 +5% | $143,600 +5% |
| 2014 | $1,163 -8.5% | $136,820 -8.5% |
| 2013 | $1,271 -10.4% | $149,500 -10.4% |
| 2012 | $1,418 | $166,860 |
| 2011 | $1,418 -21.5% | $166,860 -21.5% |
| 2010 | $1,806 -4.6% | $212,480 -4.6% |
| 2009 | $1,893 +48.5% | $222,730 +53.7% |
| 2007 | $1,275 +19.5% | $144,890 +24.9% |
| 2006 | $1,067 +79.7% | $115,990 +19% |
| 2005 | $594 +164.1% | $97,500 +14.9% |
| 2004 | $225 +5.9% | $84,860 +14.3% |
| 2003 | $212 +0.5% | $74,240 +0.3% |
| 2002 | $211 +24% | $74,036 +13% |
| 2001 | $170 | $65,519 |
Find assessor info on the county website
Monthly payment
Est. payment
Payment breakdown
Explore the cost of this home by adjusting the details. Changes won't be saved.Climate risks
Neighborhood: Benning Ridge
Nearby schools
Schools provided by the listing agent
- District: District Of Columbia Public Schools
Source: Bright MLS. This data may not be complete. We recommend contacting the local school district to confirm school assignments for this home.
Similar homes
- $199,0003 bd2 ba1.2k sqft225 55th St NE, Washington, DC 20019For Sale
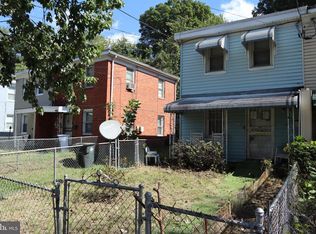
 MLS ID #DCDC2286696, Van Johnson, Samson Properties. Bright MLS
- $--2 bd1 ba1k sqft4002 E St S Unit E-205, Washington, DC 20019Auction
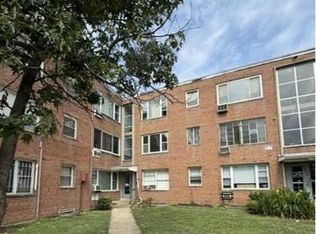 Auction.com 1
- $200,0003 bd1 ba864 sqft5727 Eagle St, Capitol Heights, MD 20743For Sale
 MLS ID #MDPG2225736, Michael Gray, Samson Properties. Bright MLS
- $190,0005 bd2 ba1.3k sqft5101 F St SE, Washington, DC 20019For Sale
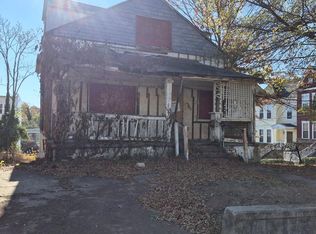 MLS ID #DCDC2265448, Larry Lessin, Homes By Owner. Bright MLS
- $195,0003 bd2 ba1.2k sqft6312 Seat Pleasant Dr, Capitol Heights, MD 20743For SaleMLS ID #MDPG2226330, Veronica Henderson, Veronica London Properties. Bright MLS
- $280,0002 bd2 ba992 sqft4433 Texas Ave SE, Washington, DC 20019For SaleMLS ID #DCDC2280850, JERRIMENI HIGHTOWER, Delta Exclusive Realty, LLC. Bright MLS
- $175,0002 bd1 ba1.1k sqft854 51st St NE, Washington, DC 20019For SaleMLS ID #DCDC2282020, Eboneese Thompson, Thompson Premier Homes Group.. Bright MLS
- $290,0002 bd1 ba1.2k sqft4415 C St SE, Washington, DC 20019For SaleMLS ID #DCDC2279128, Norva Madden, Long & Foster Real Estate, Inc.. Bright MLS
- $179,9002 bd1 ba635 sqftMarshall Heights, Washington, DC 20019For SaleMLS ID #DCDC2275198, Bode Akinola, Paragon Realty, LLC. Bright MLS
- $212,0002 bd1 ba1.1k sqft4910 Nannie Helen Burroughs Ave NE, Washington, DC 20019For SaleMLS ID #DCDC2264336, Brandy Brown, LPT Realty, LLC. Bright MLS
- $210,0002 bd2 ba1.1k sqft101 33rd St NE, Washington, DC 20019For SaleMLS ID #DCDC2234042, Michelle Kim, Long & Foster Real Estate, Inc.. Bright MLS
- $175,0003 bd1 ba719 sqft3956 Pennsylvania Ave SE APT 304, Washington, DC 20020For SaleMLS ID #DCDC2289770, Sherina Garner, Keller Williams Preferred Properties. Bright MLS
- $165,0002 bd1 ba990 sqftEast Capitol Gardens, Washington, DC 20019For SaleMLS ID #DCDC2276018, Dan Martin, Long & Foster Real Estate, Inc.. Bright MLS
- $174,900-- bd-- ba1k sqft3987 Blaine St NE, Washington, DC 20019For SaleMLS ID #DCDC2243500, Marc Blair, Own Real Estate. Bright MLS
- $250,0003 bd2 ba1k sqft5107 Cumberland St, Capitol Heights, MD 20743For SaleMLS ID #MDPG2225824, Francine Parks, EXP Realty, LLC. Bright MLS
