If you’ve been looking for a home with some actual room to spread out, take a look at this one. This 4 bedroom, 2.5 bath home has a huge living room, a spacious kitchen, and plenty of room upstairs with all four bedrooms and both full bathrooms. Everything has been updated with a clean, modern look, so there’s not a long list of projects waiting for you after closing. Out back, the yard is BIG and surprisingly private with plenty of room to enjoy without feeling like you’re sitting on top of the neighbors. Add in the attached garage, and you’ve got a home that checks a lot of boxes without needing a whole lot of work.
Active
$345,000
5266 Landview Dr, Newburgh, IN 47630
4beds
2,586sqft
Single Family Residence
Built in 1976
0.29 Acres Lot
$332,800 Zestimate®
$--/sqft
$-- HOA
What's special
Attached garageSpacious kitchen
- 45 days
- 174
- 28
Zillow last checked:
Listing updated:
Listed by:
Beau Johnson 812-766-0419,
@properties
Source: IRMLS,MLS#: 202640710
Facts & features
Interior
Bedrooms & bathrooms
- Bedrooms: 4
- Bathrooms: 3
- Full bathrooms: 2
- 1/2 bathrooms: 1
Bedroom 1
- Level: Upper
Bedroom 2
- Level: Upper
Heating
- Forced Air
Cooling
- Central Air
Features
- Basement: Crawl Space
- Number of fireplaces: 1
- Fireplace features: Dining Room
Interior area
- Total structure area: 2,586
- Total interior livable area: 2,586 sqft
- Finished area above ground: 2,586
- Finished area below ground: 0
Video & virtual tour
Property
Parking
- Total spaces: 2
- Parking features: Attached
- Attached garage spaces: 2
Features
- Levels: Two
- Stories: 2
Lot
- Size: 0.29 Acres
- Features: Level
Details
- Parcel number: 871235102103.000019
Construction
Type & style
- Home type: SingleFamily
- Property subtype: Single Family Residence
Materials
- Brick
Condition
- New construction: No
- Year built: 1976
Utilities & green energy
- Sewer: Public Sewer
- Water: Public
Community & HOA
Community
- Subdivision: South Broadview
Location
- Region: Newburgh
Financial & listing details
- Tax assessed value: $251,300
- Annual tax amount: $1,535
- Date on market: 10/1/2026
- Listing terms: Cash,Conventional,FHA,VA Loan
Estimated market value
$332,800
$316,000 - $349,000
$2,216/mo
Price history
| Date | Event | Price |
|---|---|---|
| 10/1/2026 | Listed for sale | $345,000+15% |
Source:  IRMLS #202640710 Report a problem | ||
| 4/21/2023 | Listing removed | -- |
Source: Zillow Rentals Report a problem | ||
| 4/14/2023 | Listed for rent | $2,950-34.4%$1/sqft |
Source: Zillow Rentals Report a problem | ||
| 4/14/2023 | Listing removed | -- |
Source: Zillow Rentals Report a problem | ||
| 3/13/2023 | Price change | $4,500+104.5%$2/sqft |
Source: Zillow Rentals Report a problem | ||
| 3/11/2023 | Listed for rent | $2,200+84.1%$1/sqft |
Source: Zillow Rentals Report a problem | ||
| 2/18/2023 | Listing removed | -- |
Source: Owner Report a problem | ||
| 11/30/2022 | Price change | $299,900-6.3%$116/sqft |
Source: Owner Report a problem | ||
| 6/23/2022 | Listed for sale | $319,900+4.9%$124/sqft |
Source: Owner Report a problem | ||
| 6/9/2022 | Listing removed | $304,900 |
Source: IRMLS #202204141 Report a problem | ||
| 4/19/2022 | Listed for sale | $304,900 |
Source: IRMLS #202204141 Report a problem | ||
| 4/8/2022 | Pending sale | $304,900 |
Source: IRMLS #202204141 Report a problem | ||
| 3/31/2022 | Price change | $304,900-1.6% |
Source: IRMLS #202204141 Report a problem | ||
| 3/15/2022 | Listed for sale | $309,900 |
Source: IRMLS #202204141 Report a problem | ||
| 2/28/2022 | Pending sale | $309,900 |
Source: IRMLS #202204141 Report a problem | ||
| 2/22/2022 | Price change | $309,900-1.6% |
Source: IRMLS #202204141 Report a problem | ||
| 2/10/2022 | Listed for sale | $314,900+75% |
Source: IRMLS #202204141 Report a problem | ||
| 9/20/2021 | Listing removed | -- |
Source: Owner Report a problem | ||
| 6/22/2021 | Price change | $179,900-5.3%$70/sqft |
Source: Owner Report a problem | ||
| 6/18/2021 | Listed for sale | $189,900$73/sqft |
Source: Owner Report a problem | ||
| 7/22/2015 | Listing removed | $1,195 |
Source: Fetter Properties Management Inc. Report a problem | ||
| 6/23/2015 | Listed for rent | $1,195 |
Source: Fetter Properties Management Inc. Report a problem | ||
| 4/21/2014 | Listing removed | $1,195 |
Source: Fetter Properties Report a problem | ||
| 3/12/2014 | Listed for rent | $1,195 |
Source: Fetter Properties Report a problem | ||
Public tax history
| Year | Property taxes | Tax assessment |
|---|---|---|
| 2025 | $1,588 +3.9% | $251,300 +11.6% |
| 2024 | $1,529 -52.8% | $225,200 +2.7% |
| 2023 | $3,240 +15.2% | $219,300 -1.3% |
| 2022 | $2,812 +4.8% | $222,100 +24.4% |
| 2021 | $2,683 +1.8% | $178,600 +8% |
| 2020 | $2,635 +5.8% | $165,400 +1.7% |
| 2019 | $2,491 +3.9% | $162,700 +6.2% |
| 2018 | $2,399 -34.6% | $153,200 +3.3% |
| 2017 | $3,669 +55% | $148,300 -0.5% |
| 2016 | $2,367 +2.6% | $149,100 -1.6% |
| 2014 | $2,308 +5.4% | $151,500 +3.1% |
| 2013 | $2,189 +1.9% | $147,000 +3.8% |
| 2012 | $2,149 -6.3% | $141,600 -4.5% |
| 2011 | $2,294 +2.7% | $148,300 +0.7% |
| 2010 | $2,233 -1.5% | $147,200 |
| 2009 | $2,268 +3.2% | $147,200 +1.7% |
| 2007 | $2,197 +2.4% | $144,800 +1.7% |
| 2006 | $2,147 | $142,400 |
Find assessor info on the county website
Monthly payment
Est. payment
Payment breakdown
Explore the cost of this home by adjusting the details. Changes won't be saved.Climate risks
Neighborhood: 47630
Nearby schools
Schools provided by the listing agent
- Elementary: Sharon
- Middle: Castle South
- High: Castle
- District: Warrick County School Corp.
Source: IRMLS. This data may not be complete. We recommend contacting the local school district to confirm school assignments for this home.

Similar homes
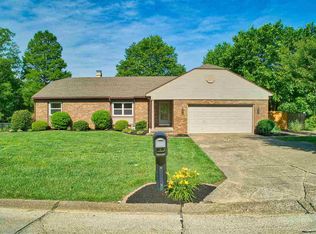
- $349,9004 bd3 ba2.5k sqft7611 Nottingham Dr, Newburgh, IN 47630For Sale
 MLS ID #202640219, Rick Mileham, ERA FIRST ADVANTAGE REALTY, INC. IRMLS
- $--3 bd2 ba2.3k sqft8188 Sycamore Dr, Newburgh, IN 47630AuctionServiceLink Auction
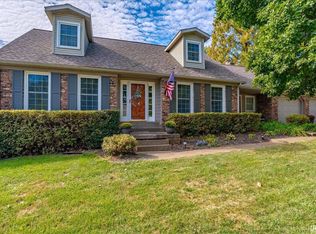
- $335,0005 bd3 ba3k sqft5411 W Esche Dr, Newburgh, IN 47630For Sale
 MLS ID #202638579, Paul Pennington, ERA FIRST ADVANTAGE REALTY, INC. IRMLS
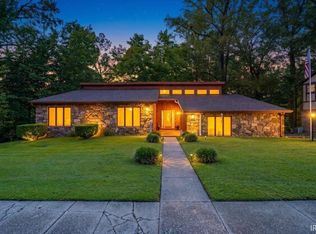
- $339,0004 bd3 ba3.3k sqft5588 Sherwood Ct, Newburgh, IN 47630For Sale
 MLS ID #202633821, Alyssa Luttrull, ERA FIRST ADVANTAGE REALTY, INC. IRMLS
- $295,9004 bd3 ba2.9k sqft5200 Landview Dr, Newburgh, IN 47630For Sale
 MLS ID #260548, Trish Haire, EXP Realty. HAMLS
