ONLY CONTACT ME IF YOU ARE A SERIOUS BUYER.
Agents wanting to sell this home for me will get a "NO" for an answer. If I need an agent in the future, I already have an agent/friend I will work with.
There are tenants currently occupying this home. The first Open House will be mid-November. (I will be able to add additional photos at that time.) New occupancy will be available the first week of December.
- A recent inspection was done Sept. 28, 2026 by Virginia State Home Inspections LLC. Necessary repairs were completed.
- A recent appraisal was done Sept. 7, 2026 by Measured Values.
For sale by owner
$270,000
529 Hyde Park Rd, Norfolk, VA 23503
3beds
1,191sqft
SingleFamily
Built in 1942
7,056 Square Feet Lot
$245,400 Zestimate®
$227/sqft
$-- HOA
Overview
What the owner loves about this home
This is a cozy home in a quiet neighborhood. Great location between the military bases and close to the Chesapeake Bay. This home also has a well.
- 2 days
- 276
- 26
Listed by:
Property Owner (757) 663-6637
Facts & features
Interior
Bedrooms & bathrooms
- Bedrooms: 3
- Bathrooms: 2
- Full bathrooms: 1
- 1/2 bathrooms: 1
Heating
- Forced air, Gas
Cooling
- Central
Appliances
- Included: Dryer, Freezer, Microwave, Range / Oven, Refrigerator, Washer
- Laundry: In Unit
Features
- Flooring: Tile, Carpet, Hardwood
- Basement: None
- Has fireplace: No
Interior area
- Total interior livable area: 1,191 sqft
Property
Parking
- Parking features: Garage - Detached, Off-street, On-street
Features
- Exterior features: Other, Vinyl
- View description: None
Lot
- Size: 7,056 Square Feet
Details
- Parcel number: 28923800
Construction
Type & style
- Home type: SingleFamily
- Architectural style: Conventional
Materials
- Frame
- Foundation: Crawl/Raised
- Roof: Shake / Shingle
Condition
- New construction: No
- Year built: 1942
Community & HOA
Location
- Region: Norfolk
Financial & listing details
- Price per square foot: $227/sqft
- Tax assessed value: $216,600
- Annual tax amount: $2,664
- Date on market: 10/19/2026
Estimated market value
$245,400
$209,000 - $277,000
$2,052/mo
Price history
| Date | Event | Price |
|---|---|---|
| 10/19/2026 | Listed for sale | $270,000+208.6%$227/sqft |
Source: Owner Report a problem | ||
| 5/15/2024 | Listing removed | -- |
Source: Zillow Rentals Report a problem | ||
| 4/22/2024 | Price change | $2,000+5.3%$2/sqft |
Source: Zillow Rentals Report a problem | ||
| 4/11/2024 | Listed for rent | $1,900$2/sqft |
Source: Zillow Rentals Report a problem | ||
| 9/11/2023 | Listing removed | -- |
Source: Zillow Rentals Report a problem | ||
| 9/5/2023 | Price change | $1,900-5%$2/sqft |
Source: Zillow Rentals Report a problem | ||
| 8/30/2023 | Listed for rent | $2,000+33.3%$2/sqft |
Source: Zillow Rentals Report a problem | ||
| 3/24/2021 | Listing removed | -- |
Source: Owner Report a problem | ||
| 3/14/2019 | Listing removed | $1,500$1/sqft |
Source: Owner Report a problem | ||
| 2/17/2019 | Listed for rent | $1,500$1/sqft |
Source: Owner Report a problem | ||
| 5/4/2018 | Listing removed | $1,500$1/sqft |
Source: Owner Report a problem | ||
| 4/29/2018 | Listed for rent | $1,500$1/sqft |
Source: Owner Report a problem | ||
| 4/12/2017 | Listing removed | $1,500$1/sqft |
Source: Owner Report a problem | ||
| 4/6/2017 | Listed for rent | $1,500$1/sqft |
Source: Owner Report a problem | ||
| 7/5/2015 | Listing removed | $1,500$1/sqft |
Source: Owner Report a problem | ||
| 6/23/2015 | Listed for rent | $1,500$1/sqft |
Source: Owner Report a problem | ||
| 11/3/2000 | Sold | $87,500$73/sqft |
Source: Agent Provided Report a problem | ||
Public tax history
| Year | Property taxes | Tax assessment |
|---|---|---|
| 2025 | $2,664 +3% | $216,600 +3% |
| 2024 | $2,587 +1.4% | $210,300 +3.1% |
| 2023 | $2,550 +4.9% | $204,000 +4.9% |
| 2022 | $2,430 +8.5% | $194,400 +8.5% |
| 2021 | $2,239 +7.3% | $179,100 +7.3% |
| 2020 | $2,086 +3.1% | $166,900 +3.1% |
| 2019 | $2,024 +5.5% | $161,900 +5.5% |
| 2018 | $1,918 +10.5% | $153,400 +1.7% |
| 2017 | $1,735 | $150,900 -1.6% |
| 2016 | $1,735 -1.6% | $153,300 |
| 2015 | $1,763 | $153,300 |
| 2014 | $1,763 | $153,300 |
| 2013 | -- | $153,300 |
| 2012 | -- | $153,300 -7.2% |
| 2011 | -- | $165,200 |
| 2010 | -- | $165,200 -8.4% |
| 2009 | -- | $180,400 |
| 2008 | -- | $180,400 +13% |
| 2007 | -- | $159,600 +6.3% |
| 2006 | -- | $150,200 +32.9% |
| 2005 | -- | $113,000 +18.8% |
| 2004 | -- | $95,100 +8.9% |
| 2003 | -- | $87,300 +5.1% |
| 2002 | -- | $83,100 +22.6% |
| 2001 | -- | $67,800 +0.1% |
| 2000 | -- | $67,750 |
Find assessor info on the county website
Monthly payment
Est. payment
Payment breakdown
Explore the cost of this home by adjusting the details. Changes won't be saved.Climate risks
Neighborhood: Hyde Park


Similar homes
- $240,0004 bd2 ba1.4k sqft516 Austin St, Norfolk, VA 23503For Sale
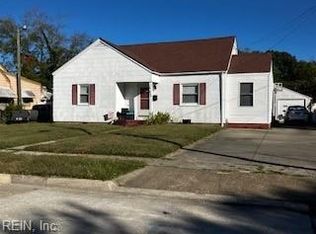 MLS ID #10658670, Jacqueline Thomas. REIN Inc.
- $225,0002 bd1 ba1.1k sqft8573 Chesapeake Blvd, Norfolk, VA 23503For Sale
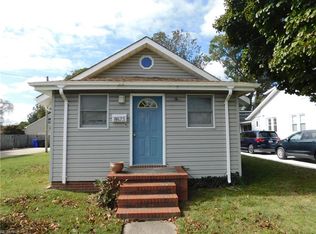 MLS ID #10658538, Wendy Plemmons. REIN Inc.
- $--3 bd1 ba969 sqft1608 Croyden Rd, Norfolk, VA 23503Auction
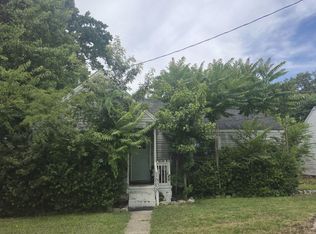 ServiceLink Auction
- $280,0003 bd1 ba1k sqft8007 Glade Rd, Norfolk, VA 23518For Sale
 MLS ID #10657711, Tania Walker. REIN Inc.
