Welcome to 5329 Waverly Road! Recently renovated and move-in ready, this affordable home features a new roof, new windows, new doors, and new flooring throughout. The beautifully updated kitchen and renovated bathroom bring fresh style and everyday comfort, while the extensive improvements mean you can unpack and enjoy your new home from day one. Nothing to do but move in! Schedule your showing today and make this home yours before it's gone.
Active
$99,500
5329 S Waverly Rd, Lansing, MI 48911
3beds
737sqft
Single Family Residence
Built in 1967
0.25 Acres Lot
$85,000 Zestimate®
$135/sqft
$-- HOA
What's special
New roofNew doorsRenovated bathroomBeautifully updated kitchenNew windowsNew flooring throughout
- 18 hours
- 65
- 8
Zillow last checked:
Listing updated:
Listed by:
Bruce Roberts-Hicks 517-528-6040,
Real Estate Warehouse L.L.C. 517-543-1119
Source: MichRIC,MLS#: 26056988
Facts & features
Interior
Bedrooms & bathrooms
- Bedrooms: 3
- Bathrooms: 1
- Full bathrooms: 1
- Main level bedrooms: 3
Heating
- Baseboard, Radiant
Appliances
- Included: Refrigerator
- Laundry: Electric Dryer Hookup, In Unit, Laundry Closet
Features
- Flooring: Carpet, Wood
- Windows: Skylight(s)
- Basement: Crawl Space
- Has fireplace: No
Interior area
- Total structure area: 737
- Total interior livable area: 737 sqft
Property
Features
- Stories: 1
Lot
- Size: 0.25 Acres
- Dimensions: 72 x 150
Details
- Parcel number: 33010506151047
Construction
Type & style
- Home type: SingleFamily
- Architectural style: Traditional
- Property subtype: Single Family Residence
Materials
- Vinyl Siding
Condition
- New construction: No
- Year built: 1967
Utilities & green energy
- Sewer: Public Sewer
- Water: Public
Community & HOA
Community
- Security: Smoke Detector(s)
Location
- Region: Lansing
Financial & listing details
- Price per square foot: $135/sqft
- Tax assessed value: $21,431
- Annual tax amount: $2,163
- Date on market: 10/26/2026
- Listing terms: Cash,FHA,VA Loan,MSHDA,Conventional
Estimated market value
$85,000
$65,000 - $105,000
$1,175/mo
Price history
| Date | Event | Price |
|---|---|---|
| 10/26/2026 | Listed for sale | $99,500+752.1%$135/sqft |
Source:  MichRIC #26056988 Report a problem | ||
| 1/29/2016 | Sold | $11,677-80.5%$16/sqft |
Source: Public Record Report a problem | ||
| 7/26/2004 | Sold | $60,000$81/sqft |
Source: Public Record Report a problem | ||
Public tax history
| Year | Property taxes | Tax assessment |
|---|---|---|
| 2025 | $1,745 +6.1% | $38,300 +29.8% |
| 2024 | $1,644 | $29,500 +12.6% |
| 2023 | -- | $26,200 +10.5% |
| 2022 | -- | $23,700 +11.8% |
| 2021 | -- | $21,200 +3.9% |
| 2020 | -- | $20,400 +5.2% |
| 2019 | $1,315 | $19,400 +16.9% |
| 2018 | $1,315 -4.3% | $16,600 |
| 2017 | $1,375 | $16,600 +1.2% |
| 2016 | $1,375 | $16,400 +1.2% |
| 2015 | $1,375 | $16,200 -9% |
| 2014 | $1,375 | $17,800 -2.7% |
| 2013 | -- | $18,300 -6.2% |
| 2012 | -- | $19,500 -9.7% |
| 2011 | -- | $21,600 -10% |
| 2010 | -- | $24,000 -8.7% |
| 2009 | -- | $26,300 -7.7% |
| 2008 | -- | $28,500 -5.3% |
| 2007 | -- | $30,100 +1.3% |
| 2006 | -- | $29,700 +8.4% |
| 2005 | -- | $27,400 +21.2% |
| 2004 | -- | $22,600 +9.2% |
| 2003 | -- | $20,700 +13.1% |
| 2002 | -- | $18,300 +1.7% |
| 2001 | -- | $18,000 +17.6% |
| 2000 | -- | $15,300 |
Find assessor info on the county website
Monthly payment
Est. payment
Payment breakdown
Explore the cost of this home by adjusting the details. Changes won't be saved.Climate risks
Neighborhood: Wexford Heights
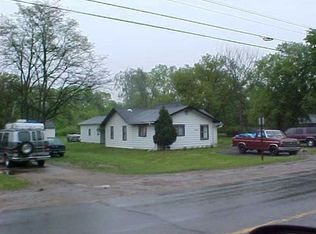


Similar homes
- $105,0003 bd1 ba894 sqft2905 Fielding Dr, Lansing, MI 48911For Sale
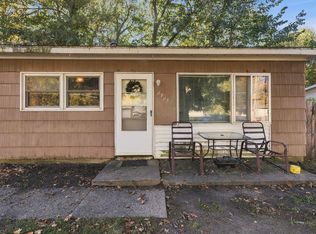
 MLS ID #26055643, Scott M Minnich, Epique Realty. MichRIC
- $--3 bd1 ba1k sqft3909 Lauderhill Cir, Lansing, MI 48911Auction
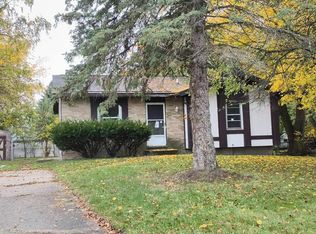 Auction.com 2
- $--3 bd1 ba960 sqft2901 Midwood St, Lansing, MI 48911Auction
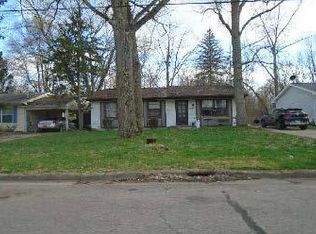 ServiceLink Auction
- $114,9003 bd1 ba894 sqft2809 Fielding Dr, Lansing, MI 48911For Sale
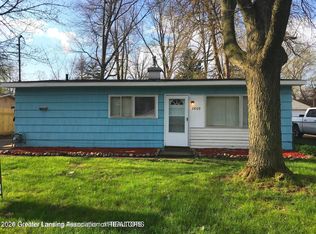 MLS ID #299775, Sheri Gallimore, RE/MAX Real Estate Professionals. Greater Lansing AOR
- $95,0002 bd1 ba835 sqft5830 S Washington Ave, Lansing, MI 48911For Sale
 MLS ID #20261083212, Amy E Frush, Prime + Property. Realcomp II
- $145,0003 bd1 ba869 sqft919 Mel Ave, Lansing, MI 48911For SaleMLS ID #26055838, Betty Fedewa-Bedard, Bedard Realty Group. MichRIC
- $109,9002 bd1 ba715 sqft1607 Mary Ave, Lansing, MI 48910For SaleMLS ID #26051893, Austin M Harris, Bellabay Realty LLC. MichRIC
- $125,0004 bd2 ba1k sqft611 W Miller Rd, Lansing, MI 48911For Sale
 MLS ID #50223254, Julie Klawuhn, Richard Selleck Agency. MiRealSource
