FHA Available Now.
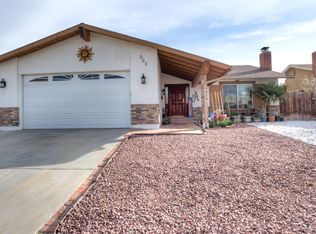
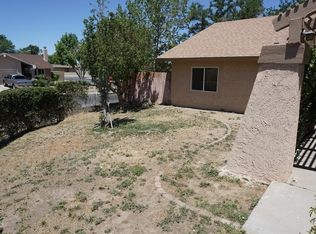
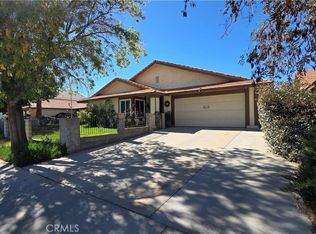
This 4bed, 2bath single story home is ready to be yours! Nicely sized rooms, wood flooring, a spacious feel in the living room. The open-concept floor plan, creates a seamless flow between the living room, dining area, and gourmet kitchen, perfect for entertaining guests. New paint, brand-new kitchen,
Hurry This wont last long.
Pre-foreclosure
Est. $490,300
533 E Avenue J5, Lancaster, CA 93535
4beds
1,753sqft
Single Family Residence
Built in 1974
6,534 Square Feet Lot
$490,300 Zestimate®
$280/sqft
$-- HOA
Overview
- 105 days
- 13
- 0
Zillow last checked:
Listing updated:
Listed by:
Eric Cussimonio DRE #02109413 661-341-4424,
Real Brokerage Technologies
Source: GAVAR,MLS#: 23006755
Facts & features
Interior
Bedrooms & bathrooms
- Bedrooms: 4
- Bathrooms: 2
- Full bathrooms: 2
Cooling
- Has cooling: Yes
Appliances
- Included: None
Features
- Has fireplace: No
- Fireplace features: None
Interior area
- Total structure area: 1,753
- Total interior livable area: 1,753 sqft
Property
Parking
- Total spaces: 2
- Parking features: Garage - Attached
- Attached garage spaces: 2
Features
- Stories: 1
- Pool features: None
Lot
- Size: 6,534 Square Feet
Details
- Parcel number: 3140024033
- Zoning: LRRA65000
Construction
Type & style
- Home type: SingleFamily
- Architectural style: Traditional
- Property subtype: Single Family Residence
Materials
- Stucco, Wood Siding
- Foundation: Slab
- Roof: Shake
Condition
- Year built: 1974
Utilities & green energy
- Water: Public
- Utilities for property: Natural Gas Available, Sewer Connected
Community & HOA
Location
- Region: Lancaster
Financial & listing details
- Price per square foot: $280/sqft
- Tax assessed value: $549,330
- Date on market: 12/1/2023
- Listing agreement: Exclusive Right To Sell
- Listing terms: VA Loan,USDA Loan,Cash,Conventional,FHA
Foreclosure details
Estimated market value
$490,300
$466,000 - $515,000
$2,647/mo
Price history
| Date | Event | Price |
|---|---|---|
| 5/1/2024 | Listing removed | -- |
Source: Zillow Rentals Report a problem | ||
| 4/10/2024 | Listed for rent | $3,500$2/sqft |
Source: Zillow Rentals Report a problem | ||
| 2/1/2024 | Sold | $528,000-9.7%$301/sqft |
Source:  GAVAR #23006755 Report a problem | ||
| 12/1/2023 | Pending sale | $585,000$334/sqft |
Source: GAVAR #23006755 Report a problem | ||
| 12/1/2023 | Price change | $585,000+33%$334/sqft |
Source: GAVAR #23006755 Report a problem | ||
| 10/30/2023 | Price change | $439,900-2.2%$251/sqft |
Source:  CRMLS #SR23181505 Report a problem | ||
| 10/19/2023 | Price change | $449,900-2.2%$257/sqft |
Source: GAVAR #23006755 Report a problem | ||
| 10/18/2023 | Listed for sale | $460,000$262/sqft |
Source: CRMLS #SR23181505 Report a problem | ||
| 10/16/2023 | Pending sale | $460,000+2.2%$262/sqft |
Source: CRMLS #SR23181505 Report a problem | ||
| 10/9/2023 | Price change | $449,900-4.3%$257/sqft |
Source: CRMLS #SR23181505 Report a problem | ||
| 9/28/2023 | Listed for sale | $469,900+40.3%$268/sqft |
Source: GAVAR #23006755 Report a problem | ||
| 8/10/2023 | Sold | $335,000-17.5%$191/sqft |
Source: Public Record Report a problem | ||
| 7/11/2023 | Pending sale | $405,900$232/sqft |
Source: GAVAR #23004502 Report a problem | ||
| 7/11/2023 | Contingent | $405,900$232/sqft |
Source: CRMLS #SR23116976 Report a problem | ||
| 6/30/2023 | Listed for sale | $405,900$232/sqft |
Source: CRMLS #SR23116976 Report a problem | ||
Public tax history
| Year | Property taxes | Tax assessment |
|---|---|---|
| 2026 | -- | $549,330 +2% |
| 2025 | $8,039 +48% | $538,560 +60.8% |
| 2024 | $5,431 +153.5% | $335,000 +375.9% |
| 2023 | $2,142 +8.5% | $70,400 +2% |
| 2022 | $1,974 +23.3% | $69,020 +2% |
| 2021 | $1,601 +0.9% | $67,667 +1% |
| 2020 | $1,586 | $66,974 +2% |
| 2019 | $1,586 +3.2% | $65,661 +2% |
| 2018 | $1,537 | $64,374 +2% |
| 2017 | $1,537 +1% | $63,113 +2% |
| 2016 | $1,522 +4.3% | $61,877 +1.5% |
| 2015 | $1,459 -0.1% | $60,949 +2% |
| 2014 | $1,461 | $59,756 +2.5% |
| 2012 | -- | $58,321 +2% |
| 2011 | -- | $57,179 +0.8% |
| 2010 | -- | $56,752 -0.2% |
| 2009 | -- | $56,888 +2% |
| 2008 | -- | $55,774 +2% |
| 2007 | -- | $54,681 +2% |
| 2006 | -- | $53,609 |
| 2005 | -- | $53,609 +4% |
| 2004 | -- | $51,530 +1.9% |
| 2003 | -- | $50,587 +2% |
| 2002 | -- | $49,596 +4% |
| 2000 | -- | $47,671 |
Find assessor info on the county website
Monthly payment
Climate risks
Neighborhood: Joshua

Similar homes
- $--3 bd2 ba1.2k sqft44237 Gillan Ave, Lancaster, CA 93535AuctionServiceLink Auction
- $449,9004 bd2 ba1.8k sqft44033 Glenraven Rd, Lancaster, CA 93535For Sale
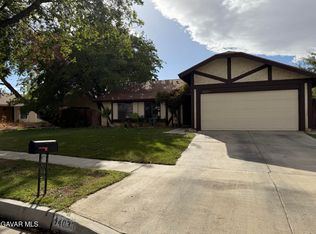 MLS ID #26008464, Salomon Maldonado. GAVAR
- $500,0004 bd2 ba1.7k sqft44124 Watford Ave, Lancaster, CA 93535For Sale
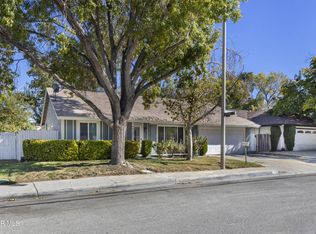 MLS ID #26008285, Prudence Stein-Greene. GAVAR
- $475,0004 bd2 ba2.1k sqft44047 Rodin Ave, Lancaster, CA 93535For Sale
 MLS ID #CV26233321, Carlo Perez, DIVISION CAPITAL INC. CRMLS
