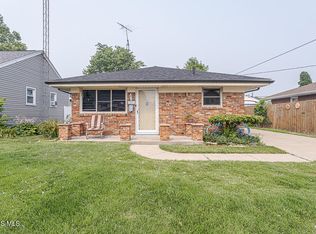
$95,000
2 bd1 ba864 sqft
5417 303rd St, Toledo, OH 43611
Sold
Zillow last checked:
Listing updated:
Katrina T Birr 419-704-0804,
The Danberry Co
$139,000
$103,000 - $175,000
$1,389/mo
| Date | Event | Price |
|---|---|---|
| 12/4/2024 | Sold | $120,000-3.9%$101/sqft |
Source: NORIS #6122483 Report a problem | ||
| 12/4/2024 | Pending sale | $124,900$105/sqft |
Source: NORIS #6122483 Report a problem | ||
| 11/4/2024 | Contingent | $124,900$105/sqft |
Source: NORIS #6122483 Report a problem | ||
| 10/28/2024 | Listed for sale | $124,900+55.2%$105/sqft |
Source: NORIS #6122483 Report a problem | ||
| 5/9/2019 | Sold | $80,500-7.5%$68/sqft |
Source: NORIS #6037955 Report a problem | ||
| 4/9/2019 | Pending sale | $87,000$73/sqft |
Source: The Danberry Co. #6037955 Report a problem | ||
| 4/5/2019 | Listed for sale | $87,000+29.9%$73/sqft |
Source: The Danberry Co #6037955 Report a problem | ||
| 5/23/2011 | Sold | $67,000-29.5%$56/sqft |
Source: Public Record Report a problem | ||
| 1/23/2010 | Listing removed | $95,000$80/sqft |
Source: Active Website #4620901 Report a problem | ||
| 1/16/2010 | Price change | $95,000-3.1%$80/sqft |
Source: Active Website #4620901 Report a problem | ||
| 8/15/2009 | Price change | $98,000-5.8%$82/sqft |
Source: The Danbery Realtors #4620901 Report a problem | ||
| 6/24/2009 | Price change | $104,000-2.8%$87/sqft |
Source: The Danbery Realtors #4620901 Report a problem | ||
| 1/14/2009 | Listed for sale | $107,000$90/sqft |
Source: The Danbery Realtors #4620901 Report a problem | ||
| Year | Property taxes | Tax assessment |
|---|---|---|
| 2025 | $2,284 -0.1% | $37,625 |
| 2024 | $2,287 +19.7% | $37,625 +25.9% |
| 2023 | $1,911 -0.1% | $29,890 |
| 2022 | $1,912 -2.3% | $29,890 |
| 2021 | $1,958 +6% | $29,890 +20.6% |
| 2020 | $1,847 +105.7% | $24,780 |
| 2019 | $898 -50.2% | $24,780 |
| 2018 | $1,803 +11.4% | $24,780 +18.2% |
| 2017 | $1,618 +0% | $20,965 -65% |
| 2016 | $1,618 +0.9% | $59,900 |
| 2015 | $1,604 +21.6% | $59,900 +185.6% |
| 2014 | $1,319 | $20,970 |
| 2013 | $1,319 +4.2% | $20,970 |
| 2012 | $1,265 -24% | $20,970 -29.3% |
| 2011 | $1,664 +0.7% | $29,650 |
| 2010 | $1,652 -1.4% | $29,650 |
| 2009 | $1,676 -5% | $29,650 -14% |
| 2008 | $1,765 +4.2% | $34,480 |
| 2007 | $1,693 +2.3% | $34,480 |
| 2006 | $1,655 +18.2% | $34,480 +18% |
| 2004 | $1,400 -0.3% | $29,230 |
| 2003 | $1,404 +1.8% | $29,230 +19.1% |
| 2002 | $1,380 +16.5% | $24,540 |
| 2001 | $1,185 -45% | $24,540 |
| 2000 | $2,152 | $24,540 |
Source: NORIS. This data may not be complete. We recommend contacting the local school district to confirm school assignments for this home.
A local agent can set up tours, give advice and negotiate with sellers.
A local lender can help you make sure your offer is ready when you are.