$691,300
3 bd|2 ba|-- sqft
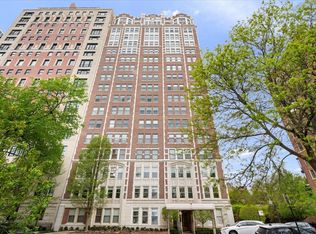
559 W Surf St APT 100, Chicago, IL 60657
Off Market

Zillow last checked:
Listing updated:
Santiago Valdez 773-858-2410,
Compass,
Elizabeth Pyle 773-383-5417,
Compass
Not available
Estimated sales range
Not available
Not available
| Date | Event | Price |
|---|---|---|
| 6/22/2026 | Contingent | $325,000 |
Source: | ||
| 6/16/2026 | Listed for sale | $325,000+38.3% |
Source: | ||
| 3/31/2021 | Sold | $235,000 |
Source: | ||
| 1/11/2021 | Price change | $235,000-4.1% |
Source: @properties #10968465 Report a problem | ||
| 9/19/2020 | Price change | $245,000-1.4% |
Source: @properties #10870893 Report a problem | ||
| 8/20/2020 | Price change | $248,500-3.3% |
Source: @properties #10870893 Report a problem | ||
| 8/23/2019 | Listing removed | $1,675 |
Source: RE/MAX 10 #10478130 Report a problem | ||
| 8/8/2019 | Listed for rent | $1,675+1.5% |
Source: RE/MAX 10 #10478130 Report a problem | ||
| 6/24/2019 | Price change | $257,000-1.2% |
Source: RE/MAX 10 #10427474 Report a problem | ||
| 6/17/2019 | Listed for sale | $260,000+9.5% |
Source: RE/MAX 10 #10419472 Report a problem | ||
| 2/20/2018 | Listing removed | $1,650 |
Source: @properties #09846739 Report a problem | ||
| 2/2/2018 | Listed for rent | $1,650 |
Source: @properties #09846739 Report a problem | ||
| 12/15/2008 | Sold | $237,500+99.6% |
Source: | ||
| 4/4/1997 | Sold | $119,000 |
Source: Public Record Report a problem | ||
| Year | Property taxes | Tax assessment |
|---|---|---|
| 2024 | -- | $22,384 +11.9% |
| 2023 | $4,220 +2.6% | $19,999 |
| 2022 | $4,113 +2.3% | $19,999 |
| 2021 | $4,022 +0.6% | $19,999 +11.5% |
| 2020 | $3,996 +1.2% | $17,939 -8.7% |
| 2019 | $3,948 +1.7% | $19,648 |
| 2018 | $3,881 +13.8% | $19,648 +24% |
| 2017 | $3,411 +27.6% | $15,845 |
| 2016 | $2,673 +10.3% | $15,845 |
| 2015 | $2,423 +12.7% | $15,845 +12% |
| 2014 | $2,149 -9.8% | $14,151 -10% |
| 2013 | $2,381 -7.2% | $15,723 -6.4% |
| 2012 | $2,565 -11.4% | $16,791 -6% |
| 2011 | $2,896 -7.9% | $17,869 -7.5% |
| 2010 | $3,143 -0.3% | $19,318 -4.5% |
| 2009 | $3,153 +20.4% | $20,222 +10.8% |
| 2008 | $2,619 +1% | $18,259 |
| 2007 | $2,593 -1.1% | $18,259 |
| 2006 | $2,621 -1.4% | $18,259 +12.2% |
| 2005 | $2,658 +1% | $16,269 |
| 2004 | $2,632 +2.2% | $16,269 |
| 2003 | $2,574 +27.7% | $16,269 +44.9% |
| 2002 | $2,017 +26.6% | $11,225 |
| 2001 | $1,593 +9.5% | $11,225 |
| 2000 | $1,455 +0.2% | $11,225 +17.2% |
| 1999 | $1,453 | $9,575 |
Find assessor info on the county website
Source: MRED as distributed by MLS GRID. This data may not be complete. We recommend contacting the local school district to confirm school assignments for this home.
A local agent can set up tours, give advice and negotiate with sellers.