Beautiful 2 bedrooms 1 bath updated unit. Freshly painted, new flooring. Close distance to Highways 85, 87, and 101. Great location in the community .
Zillow Preview
$489,000
5641 Playa Del Rey Ct APT 2, San Jose, CA 95123
2beds
903sqft
Condominium
Built in 1970
-- sqft lot
$455,000 Zestimate®
$542/sqft
$501/mo HOA
What's special
Freshly paintedNew flooring
- 146
- views
- 2
- saves
Zillow last checked:
Listed by
Sandy Jamison • DRE #01416124 • 408-802-4017
The Jamison Team - Tuscana Properties • 408-465-4899
Source: Zillow
Facts & features
Interior
Bedrooms & bathrooms
- Bedrooms: 2
- Bathrooms: 1
- Full bathrooms: 1
Features
- Has basement: No
Interior area
- Total interior livable area: 903 sqft
Property
Parking
- Total spaces: 1
- Parking features: Garage
- Garage spaces: 1
Features
- Stories: 2
Lot
- Size: 8,276 Square Feet
Details
- Parcel number: 69421030
Construction
Type & style
- Home type: Condo
- Property subtype: Condominium
Condition
- New construction: No
- Year built: 1970
Community & HOA
HOA
- HOA fee: $501 monthly
Location
- Region: San Jose
Financial & listing details
- Price per square foot: $542/sqft
- Tax assessed value: $361,724
Estimated market value
$455,000
$419,000 - $491,000
$3,052/mo
Price history
| Date | Event | Price |
|---|---|---|
| 4/29/2008 | Sold | $270,000-24.2%$299/sqft |
Source: Public Record Report a problem | ||
| 6/29/2006 | Sold | $356,000+1.7%$394/sqft |
Source: Public Record Report a problem | ||
| 7/28/2005 | Sold | $350,000$388/sqft |
Source: Public Record Report a problem | ||
Public tax history
| Year | Property taxes | Tax assessment |
|---|---|---|
| 2026 | -- | $361,724 +2% |
| 2025 | $4,884 +5% | $354,632 +2% |
| 2024 | $4,653 +2.1% | $347,680 +2% |
| 2023 | $4,559 +0.5% | $340,864 +2% |
| 2022 | $4,538 +2% | $334,182 +2% |
| 2021 | $4,449 +1.6% | $327,630 +1% |
| 2020 | $4,378 | $324,272 +2% |
| 2019 | $4,378 +2.8% | $317,914 +2% |
| 2018 | $4,258 | $311,682 +2% |
| 2017 | $4,258 +0.8% | $305,572 +2% |
| 2016 | $4,225 +3.9% | $299,582 +1.5% |
| 2015 | $4,065 +2% | $295,082 +2% |
| 2014 | $3,983 | $289,302 +33.3% |
| 2013 | -- | $217,000 +40% |
| 2012 | -- | $155,000 |
| 2011 | -- | $155,000 +4.7% |
| 2010 | -- | $148,000 -42.2% |
| 2009 | -- | $256,000 -20.9% |
| 2008 | -- | $323,800 -3.1% |
| 2007 | -- | $334,000 -4.5% |
| 2006 | -- | $349,750 +245.4% |
| 2005 | -- | $101,259 +2% |
| 2004 | -- | $99,275 +1.9% |
| 2003 | -- | $97,457 +2% |
| 2002 | -- | $95,547 +2% |
| 2001 | -- | $93,674 |
Find assessor info on the county website
Monthly payment
Est. payment
Payment breakdown
Explore the cost of this home by adjusting the details. Changes won't be saved.Climate risks
Neighborhood: Blossom Valley
- $435,3002 bd1 ba810 sqft5641 Playa Del Rey Ct APT 1, San Jose, CA 95123Off Market
- $470,3002 bd1 ba903 sqft5641 Playa Del Rey Ct APT 3, San Jose, CA 95123Off Market

- $540,3002 bd1 ba798 sqft5641 Playa Del Rey Ct APT 4, San Jose, CA 95123Off Market

- $477,5002 bd1 ba810 sqft5635 Playa Del Rey Ct APT 1, San Jose, CA 95123Off Market

Similar homes
- $478,5002 bd1 ba798 sqft5630 Allen Ave APT 4, San Jose, CA 95123For Sale
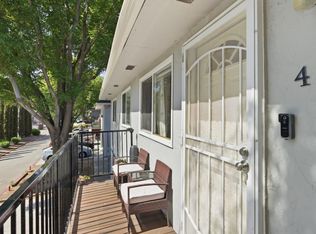 MLS ID #ML82050827, Rafael Insignare. MLSListings Inc
- $490,0002 bd1 ba903 sqft5518 Judith St APT 2, San Jose, CA 95123For Sale
 MLS ID #ML82065069, Sam Zumot. MLSListings Inc
- $448,0002 bd1 ba798 sqft757 Warring Dr APT 4, San Jose, CA 95123For Sale
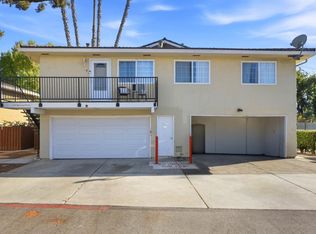 MLS ID #ML82061484, Terry Jarrouche. MLSListings Inc
- $475,0002 bd1 ba959 sqft303 Tradewinds Dr APT 10, San Jose, CA 95123For Sale
 MLS ID #ML82055237, Jay Deimling. MLSListings Inc
