$543,200
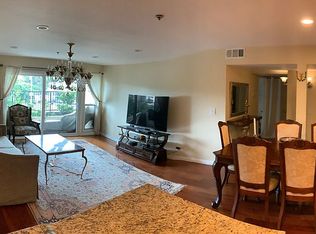
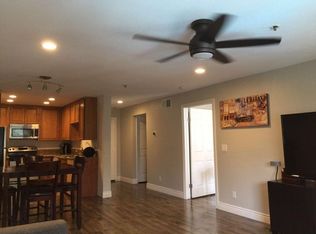
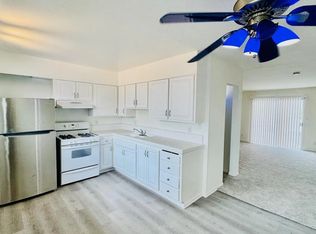
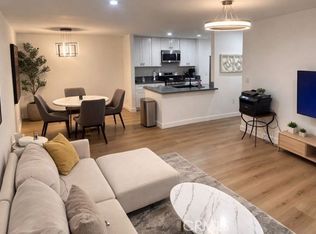
2 bd|2 ba|1.1k sqft
5705 Friars Rd UNIT 1, San Diego, CA 92110
Off Market
Zillow last checked:
Listing updated:
Kathey Busse DRE #00576562 714-272-0968,
First Team Real Estate
$449,900
$427,000 - $472,000
$2,329/mo
| Date | Event | Price |
|---|---|---|
| 6/18/2026 | Listed for sale | $459,000+14.8%$660/sqft |
Source: | ||
| 8/19/2025 | Sold | $400,000-4.8%$576/sqft |
Source: | ||
| 7/5/2025 | Pending sale | $420,000$604/sqft |
Source: | ||
| 5/20/2025 | Price change | $420,000-7.5%$604/sqft |
Source: | ||
| 1/8/2025 | Listed for sale | $454,000+100.9%$653/sqft |
Source: | ||
| 9/11/2015 | Sold | $226,000-5.4%$325/sqft |
Source: Public Record Report a problem | ||
| 8/31/2015 | Pending sale | $239,000$344/sqft |
Source: GRE Land & Commercial RE #SW15146190 Report a problem | ||
| 8/14/2015 | Price change | $239,000-7.7%$344/sqft |
Source: GRE Land & Commercial RE #SW15146190 Report a problem | ||
| 8/8/2015 | Price change | $259,000+8.4%$373/sqft |
Source: GRE Land & Commercial RE #SW15146190 Report a problem | ||
| 8/3/2015 | Price change | $239,000-7.7%$344/sqft |
Source: GRE Land & Commercial RE #SW15146190 Report a problem | ||
| 7/27/2015 | Price change | $259,000+3.6%$373/sqft |
Source: GRE Land & Commercial RE #SW15146190 Report a problem | ||
| 7/6/2015 | Listed for sale | $250,000+39.7%$360/sqft |
Source: GRE Land & Commercial RE #SW15146190 Report a problem | ||
| 9/7/2012 | Listing removed | $1,195$2/sqft |
Source: PropertyADVANTAGE Report a problem | ||
| 8/14/2012 | Listed for rent | $1,195$2/sqft |
Source: PropertyADVANTAGE Report a problem | ||
| 11/7/2002 | Sold | $179,000+90.4%$258/sqft |
Source: Public Record Report a problem | ||
| 5/14/1999 | Sold | $94,000$135/sqft |
Source: Public Record Report a problem | ||
| Year | Property taxes | Tax assessment |
|---|---|---|
| 2025 | $3,380 +3.9% | $267,527 +2% |
| 2024 | $3,253 +2.3% | $262,282 +2% |
| 2023 | $3,181 +2.7% | $257,141 +2% |
| 2022 | $3,097 +0.7% | $252,100 +2% |
| 2021 | $3,076 +1.2% | $247,158 +1% |
| 2020 | $3,039 +2.8% | $244,625 +2% |
| 2019 | $2,955 +5.8% | $239,830 +2% |
| 2018 | $2,792 +2.4% | $235,128 +2% |
| 2017 | $2,726 +1.6% | $230,519 +2% |
| 2016 | $2,682 +15.7% | $226,000 +15.9% |
| 2015 | $2,318 +2.2% | $195,000 +2.6% |
| 2014 | $2,269 | $190,000 +8% |
| 2013 | -- | $176,000 +4.8% |
| 2012 | -- | $168,000 |
| 2011 | -- | $168,000 |
| 2010 | -- | $168,000 -16.5% |
| 2009 | -- | $201,315 +2% |
| 2008 | -- | $197,368 +2% |
| 2007 | -- | $193,499 +2% |
| 2006 | -- | $189,706 +2% |
| 2005 | -- | $185,987 +2% |
| 2004 | -- | $182,341 +1.9% |
| 2003 | -- | $179,000 +25.4% |
| 2002 | -- | $142,800 +46% |
| 2001 | -- | $97,796 |
Find assessor info on the county website
A local agent can set up tours, give advice and negotiate with sellers.
Local buyer's agents are ready to help