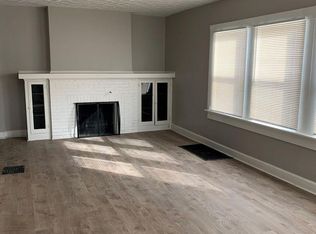
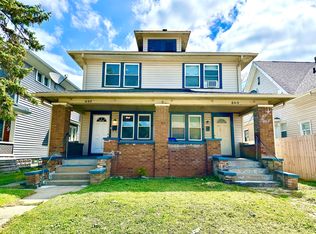
**INVESTORS** Add to your Investment Portfolio - Discover this Turnkey Cash Flow Opportunity - This one is 100% ready to go and generating $2595/mo in combined gross rents. Both sides are occupied and were renovated in 2022. Two units of approximately 1400 sqft, each with 3 bedrooms, 1 bath, covered porches and a separate entrance. Each unit features granite countertops, stainless appliances, wash/dryer hook-ups and LVP flooring throughout. Each unit has an unfinished private basement for extra storage. There is space in the back to offer off-street parking. Near Eastside - close to downtown Indy, Mass Ave and Irvington.
Active
Price cut: $25K (9/21)
$249,900
601 N Oxford St, Indianapolis, IN 46201
6beds
2baths
--sqft
Multi Family, Duplex
Built in 1920
-- sqft lot
$-- Zestimate®
$--/sqft
$-- HOA
What's special
Covered porchesGranite countertopsStainless appliancesLvp flooring throughout
- 45 days
- 182
- 29
Zillow last checked:
Listing updated:
Listed by:
Jenn Marlow jenn@marlowrealtygroup.com,
Trueblood Real Estate
Source: MIBOR as distributed by MLS GRID,MLS#: 22124635
Facts & features
Interior
Bedrooms & bathrooms
- Bedrooms: 6
- Bathrooms: 2
- Main level bathrooms: 6
Appliances
- Laundry: None
Features
- Has basement: Yes
Property
Parking
- Parking features: Alley Access
- Details: Unit Parking(On Street, Paved Area)
Features
- Levels: Two
- Stories: 2
- Fencing: Fenced,Partial
Lot
- Size: 5,662 Square Feet
- Features: Access, Corner Lot
Details
- Parcel number: 491005217017000101
Construction
Type & style
- Home type: MultiFamily
- Architectural style: Traditional
- Property subtype: Multi Family, Duplex
- Attached to another structure: Yes
Materials
- Aluminum Siding
Condition
- New construction: No
- Year built: 1920
Community & HOA
Community
- Security: Smoke Detector(s)
- Subdivision: J P Madingers Heirs
Location
- Region: Indianapolis
Financial & listing details
- Tax assessed value: $300,600
- Annual tax amount: $7,190
- Date on market: 9/8/2026
- Cumulative days on market: 47 days
Estimated market value
Not available
Estimated sales range
Not available
Not available
Price history
| Date | Event | Price |
|---|---|---|
| 9/21/2026 | Price change | $249,900-9.1% |
Source:  MIBOR as distributed by MLS GRID #22124635 Report a problem | ||
| 9/8/2026 | Listed for sale | $274,900+15.1% |
Source: MIBOR as distributed by MLS GRID #22124635 Report a problem | ||
| 2/18/2026 | Listing removed | $1,100 |
Source: Zillow Rentals Report a problem | ||
| 2/11/2026 | Price change | $1,100-4.3% |
Source: Zillow Rentals Report a problem | ||
| 1/20/2026 | Price change | $1,150-4.1% |
Source: Zillow Rentals Report a problem | ||
| 10/21/2025 | Price change | $1,199-7.7% |
Source: Zillow Rentals Report a problem | ||
| 10/14/2025 | Price change | $1,299-7.1% |
Source: Zillow Rentals Report a problem | ||
| 9/30/2025 | Price change | $1,399-6.7% |
Source: Zillow Rentals Report a problem | ||
| 9/17/2025 | Listed for rent | $1,499+25.4% |
Source: Zillow Rentals Report a problem | ||
| 5/2/2023 | Listing removed | -- |
Source: Zillow Rentals Report a problem | ||
| 4/21/2023 | Price change | $1,195-7.7% |
Source: Zillow Rentals Report a problem | ||
| 2/28/2023 | Listed for rent | $1,295 |
Source: Zillow Rentals Report a problem | ||
| 5/29/2022 | Listing removed | -- |
Source: Zillow Rental Manager Report a problem | ||
| 5/19/2022 | Listed for rent | $1,295+17.8% |
Source: Zillow Rental Manager Report a problem | ||
| 2/1/2022 | Sold | $238,934+14.3% |
Source: MIBOR as distributed by MLS GRID #21829593 Report a problem | ||
| 1/4/2022 | Pending sale | $209,000 |
Source: MIBOR as distributed by MLS GRID #21829593 Report a problem | ||
| 12/29/2021 | Listed for sale | $209,000+596.7% |
Source: MIBOR as distributed by MLS GRID #21829593 Report a problem | ||
| 5/27/2021 | Listing removed | -- |
Source: Zillow Rental Network Premium_1 Report a problem | ||
| 2/24/2021 | Listed for rent | $1,099 |
Source: Zillow Rental Network Premium_1 Report a problem | ||
| 7/5/2019 | Sold | $30,000-40% |
Source: Public Record Report a problem | ||
| 10/29/2003 | Sold | $50,000 |
Source: MIBOR as distributed by MLS GRID #2349685 Report a problem | ||
Public tax history
| Year | Property taxes | Tax assessment |
|---|---|---|
| 2025 | $5,757 +5.2% | $300,600 +23.9% |
| 2024 | $5,470 +68.1% | $242,600 +5.2% |
| 2023 | $3,253 +17.3% | $230,600 +67.3% |
| 2022 | $2,773 +15.5% | $137,800 +14.6% |
| 2021 | $2,401 +6.1% | $120,200 +15.9% |
| 2020 | $2,264 +26.9% | $103,700 +8.1% |
| 2019 | $1,784 +10.4% | $95,900 +28% |
| 2018 | $1,616 +27% | $74,900 +2.5% |
| 2017 | $1,273 +12.6% | $73,100 +30.3% |
| 2016 | $1,130 +15.4% | $56,100 +23.8% |
| 2014 | $979 -12% | $45,300 +0.2% |
| 2013 | $1,113 | $45,200 -8.5% |
| 2012 | $1,113 | $49,400 +23.5% |
| 2011 | -- | $40,000 |
| 2010 | $837 -2.4% | $40,000 |
| 2009 | $857 | $40,000 +1.8% |
| 2007 | -- | $39,300 -34.2% |
| 2006 | -- | $59,700 -21.1% |
| 2005 | -- | $75,700 |
| 2004 | -- | $75,700 |
| 2003 | -- | $75,700 +267.5% |
| 2002 | -- | $20,600 +191.4% |
| 2001 | -- | $7,070 |
| 2000 | -- | $7,070 |
Find assessor info on the county website
Monthly payment
Est. payment
Payment breakdown
Explore the cost of this home by adjusting the details. Changes won't be saved.Climate risks
Neighborhood: Near Eastside


Similar homes
- $300,0003 bd2 ba1.1k sqft1420 E Market St, Indianapolis, IN 46201For Sale

 MLS ID #110830, RODNEY B SNEATH, A & B HOMES. THAAR
- $225,0003 bd2 ba1.8k sqft1234 N Tacoma Ave, Indianapolis, IN 46201Active
 MLS ID #22124508, Dylan Hostetter, United Real Estate Indpls. MIBOR as distributed by MLS GRID
- $229,0003 bd2 ba2.3k sqft17 N Randolph St, Indianapolis, IN 46201Active
 MLS ID #22123819, Joshua Matthews, @properties. MIBOR as distributed by MLS GRID
- $228,0003 bd3 ba2.2k sqft614 N Bosart Ave, Indianapolis, IN 46201Active
 MLS ID #22118746, Gabriel Moore, @properties. MIBOR as distributed by MLS GRID
