Off Market deal!
Home comes FULLY furnished! Set on over a half acre in a highly desirable family neighborhood of West Warwick Ri.
~ New Roof
~ New Hot Water Tank
~ New Trex Decks
~ New Pool and Jacuzzi
~ New Flooring
~ New Appliances
~ Granite Counters
~ Updated Kitchen And Baths
~ Washer And Dryer
~ Two Car Garage
Email Damato1987@yahoo.com or call 954-892-3156
For sale by owner
Price cut: $20.1K (10/19)
$574,900
61 Lonsdale St, West Warwick, RI 02893
3beds
2,200sqft
SingleFamily
Built in 2001
0.5 Acres Lot
$-- Zestimate®
$261/sqft
$-- HOA
What's special
New pool and jacuzziFully furnishedWasher and dryerTwo car garageNew flooringNew appliancesNew roof
- 103 days
- 2,767
- 20
Listed by:
Property Owner (954) 892-3156
Facts & features
Interior
Bedrooms & bathrooms
- Bedrooms: 3
- Bathrooms: 2
- Full bathrooms: 2
Heating
- Forced air, Gas
Cooling
- Central
Appliances
- Included: Dishwasher, Dryer, Freezer, Garbage disposal, Microwave, Range / Oven, Refrigerator, Trash compactor, Washer
Features
- Flooring: Tile, Hardwood, Laminate
- Basement: Finished
- Has fireplace: No
Interior area
- Total interior livable area: 2,200 sqft
Property
Parking
- Total spaces: 5
- Parking features: Garage - Attached
Features
- Exterior features: Other, Vinyl
- Has spa: Yes
Lot
- Size: 0.5 Acres
Details
- Parcel number: WWAR01107570000
Construction
Type & style
- Home type: SingleFamily
Materials
- Frame
- Roof: Asphalt
Condition
- New construction: No
- Year built: 2001
Utilities & green energy
- Electric: 220 Volts, 150 Amps
- Sewer: Assessment to Seller, Municipal, Assessment
Community & HOA
Location
- Region: West Warwick
Financial & listing details
- Price per square foot: $261/sqft
- Tax assessed value: $445,600
- Annual tax amount: $6,368
- Date on market: 7/14/2026
Estimated market value
Not available
Estimated sales range
Not available
$2,812/mo
Price history
| Date | Event | Price |
|---|---|---|
| 10/19/2026 | Price change | $574,900-3.4%$261/sqft |
Source: Owner Report a problem | ||
| 10/6/2026 | Price change | $595,000+3.5%$270/sqft |
Source: Owner Report a problem | ||
| 9/4/2026 | Price change | $575,000-8%$261/sqft |
Source:  StateWide MLS RI #1421678 Report a problem | ||
| 7/27/2026 | Listed for sale | $625,000+135.8%$284/sqft |
Source: StateWide MLS RI #1418914 Report a problem | ||
| 12/19/2017 | Sold | $265,000-8.6%$120/sqft |
Source: StateWide MLS RI #1176865 Report a problem | ||
| 10/31/2017 | Listed for sale | $289,900+26%$132/sqft |
Source: RI Real Estate Services #1176865 Report a problem | ||
| 11/22/2002 | Sold | $230,000+24.3%$105/sqft |
Source: Public Record Report a problem | ||
| 2/19/2002 | Sold | $185,000$84/sqft |
Source: Public Record Report a problem | ||
Public tax history
| Year | Property taxes | Tax assessment |
|---|---|---|
| 2025 | $6,368 -1.6% | $445,600 +28.7% |
| 2024 | $6,472 +2% | $346,300 |
| 2023 | $6,344 +1.6% | $346,300 |
| 2022 | $6,247 -3.6% | $346,300 +22.9% |
| 2021 | $6,481 | $281,800 |
| 2020 | $6,481 -21.6% | $281,800 |
| 2019 | $8,262 +39.4% | $281,800 +29.2% |
| 2018 | $5,928 +3.3% | $218,100 |
| 2017 | $5,738 +1.8% | $218,100 |
| 2016 | $5,636 +4.4% | $218,100 +4.9% |
| 2015 | $5,400 +309% | $208,000 |
| 2014 | $1,320 -74.3% | $208,000 |
| 2013 | $5,131 +12.8% | $208,000 -2.1% |
| 2011 | $4,548 | $212,500 |
| 2010 | $4,548 -7.3% | $212,500 -27.2% |
| 2009 | $4,908 +5.7% | $291,800 |
| 2008 | $4,645 +4.3% | $291,800 |
| 2007 | $4,453 +7.6% | $291,800 +25.1% |
| 2006 | $4,139 +67.2% | $233,300 |
| 2004 | $2,476 +15.7% | $233,300 +240.6% |
| 2003 | $2,140 | $68,500 |
Find assessor info on the county website
Monthly payment
Est. payment
Payment breakdown
Explore the cost of this home by adjusting the details. Changes won't be saved.Climate risks
Neighborhood: 02893
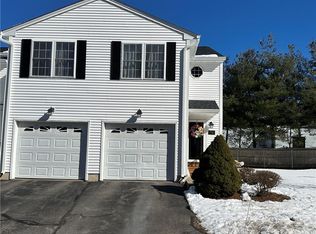

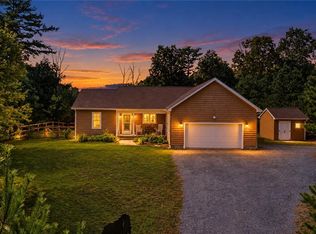
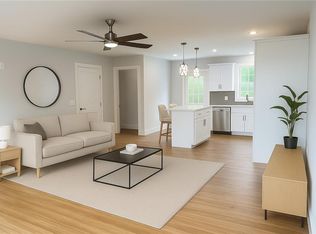
Similar homes
- $574,9003 bd3 ba3.2k sqft19 Gilcrest Dr, West Warwick, RI 02893For Sale
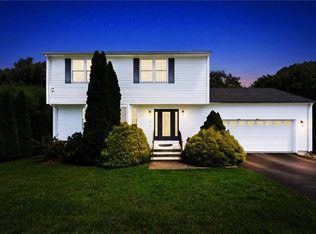
 MLS ID #1426577, James Manzo, REMAX Revolution. StateWide MLS RI
- $475,0004 bd2 ba1.9k sqft20 Judy Ter, West Warwick, RI 02893For Sale
 MLS ID #1425837, Dina Karousos/Nicole Lucenti Team, SERHANT.. StateWide MLS RI
- $485,0003 bd2 ba2.3k sqft66 Phenix Ave, West Warwick, RI 02893For Sale
 MLS ID #1426529, Ryan Lineham, Homistic Real Estate, Inc.. StateWide MLS RI
- $525,9003 bd2 ba1.7k sqft51 River Ave, West Warwick, RI 02893For Sale
 MLS ID #1421941, Pam Soule, Coldwell Banker Realty. StateWide MLS RI
- $489,9003 bd3 ba2k sqft68 Leaf St, West Warwick, RI 02893For SaleMLS ID #1406246, Yvonne Sousa, RISE REC. StateWide MLS RI
- $530,0005 bd3 ba2.1k sqft24 Kenmore St, West Warwick, RI 02893For SaleMLS ID #1422232, Lavonne Lopes, Keller Williams Coastal. StateWide MLS RI
- $475,0003 bd2 ba3k sqft44 Dion Ave, Coventry, RI 02816For SaleMLS ID #1426457, Dennis Warburton, Keller Williams Coastal. StateWide MLS RI
- $548,0003 bd2 ba1.9k sqft30 Black Creek Ln, Warwick, RI 02888For SaleMLS ID #1426466, Adam Cardinal, REMAX Revolution. StateWide MLS RI
- $479,9004 bd2 ba1.6k sqft37 Revere Ave, West Warwick, RI 02893For SaleMLS ID #1421992, Tyler Gammons, BHHS Commonwealth Real Estate. StateWide MLS RI
- $575,0003 bd2 ba2.1k sqft392 Hillsdale Rd, Richmond, RI 02892For SaleMLS ID #1425418, Jenny Palm Group, SERHANT.. StateWide MLS RI
- $560,0006 bd4 ba2.4k sqft21 Church St, West Warwick, RI 02893For SaleMLS ID #1420288, Pascaline Uwase, Realty One Group Dream Makers. StateWide MLS RI
- $574,9003 bd4 ba3.1k sqft10 Sycamore Dr, Coventry, RI 02816For SaleMLS ID #1423238, Denise Leonard, BHHS Commonwealth Real Estate. StateWide MLS RI
- $550,0003 bd1 ba1.7k sqft1720 Harkney Hill Rd, Coventry, RI 02816For SaleMLS ID #1425709, Aaron Coutu, Keller Williams Leading Edge. StateWide MLS RI
- $599,0003 bd3 ba3.2k sqft11 Birchwood Ln, Coventry, RI 02816For SaleMLS ID #1422984, Diana Tavares, RI Real Estate Services. StateWide MLS RI
- $499,0003 bd2 ba2.1k sqft159 Hanover St, Warwick, RI 02886For SaleMLS ID #1424517, Kate DeSimone, Williams & Stuart Real Estate. StateWide MLS RI
- $499,0002 bd2 ba1.5k sqft15 Deer Run, Cranston, RI 02921For SaleMLS ID #1426590, Thomas Michael, Weichert REALTORS-Atlantic Prp. StateWide MLS RI
- $575,9002 bd2 ba1.1k sqft62 Sweetfern Rd, Warwick, RI 02888For SaleMLS ID #1426102, Denise Leonard, BHHS Commonwealth Real Estate. StateWide MLS RI
- $423,0003 bd2 ba1.1k sqft17 E Greenwich Ave, West Warwick, RI 02893For SaleMLS ID #1425641, Slocum Home Team, eXp Realty. StateWide MLS RI
- $584,9003 bd2 ba1.8k sqft32 Mountaindale Rd, Smithfield, RI 02917For SaleMLS ID #1422159, Ronald Rusin, Lamacchia Realty, Inc. StateWide MLS RI
- $435,0003 bd2 ba1.7k sqft99 George Arden Ave, Warwick, RI 02886For SaleMLS ID #1426567, Aaron Coutu, Keller Williams Leading Edge. StateWide MLS RI
