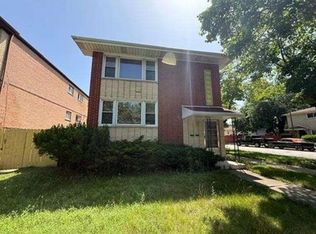
Solid brick 3 flat in the Roseland neighborhood. Each unit boasts 2 bedrooms, 1 bathroom and a Detached garage. Property being sold in AS IS condition, no surveys nor disclosures, taxes prorated. This property is subject to a 3-Day First Look Period. Seller does not accept blind offers or escalation clauses.
Active
$270,000
619 E 102nd Pl, Chicago, IL 60628
6beds
--sqft
Multi Family
Built in 1929
-- sqft lot
$268,400 Zestimate®
$--/sqft
$-- HOA
What's special
Detached garage
- 13 days
- 252
- 22
Zillow last checked:
Listing updated:
Listed by:
Michael Olszewski 708-220-1791,
Area Wide Realty
Source: MRED as distributed by MLS GRID,MLS#: 12791283
Facts & features
Interior
Bedrooms & bathrooms
- Bedrooms: 6
- Bathrooms: 3
- Full bathrooms: 3
Heating
- Has Heating (Unspecified Type)
Features
- Basement: Unfinished,Full
Property
Parking
- Total spaces: 3
- Parking features: Yes, Detached, Garage
- Garage spaces: 3
Lot
- Size: 3,484 Square Feet
- Dimensions: 24x125
Details
- Parcel number: 25104180060000
- Special conditions: None
Construction
Type & style
- Home type: MultiFamily
- Property subtype: Multi Family
Materials
- Brick
Condition
- New construction: No
- Year built: 1929
Utilities & green energy
- Sewer: Public Sewer
- Water: Public
Community & HOA
Location
- Region: Chicago
Financial & listing details
- Tax assessed value: $172,000
- Annual tax amount: $3,581
- Date on market: 10/21/2026
- Ownership: Fee Simple
Estimated market value
$268,400
$255,000 - $282,000
$2,230/mo
Price history
| Date | Event | Price |
|---|---|---|
| 9/25/2026 | Listed for sale | $270,000 |
Source:  MRED as distributed by MLS GRID #12769916 Report a problem | ||
Public tax history
| Year | Property taxes | Tax assessment |
|---|---|---|
| 2024 | $3,465 +82% | $17,200 +91.1% |
| 2023 | $1,904 +2.5% | $9,000 |
| 2022 | $1,857 +2.3% | $9,000 |
| 2021 | $1,815 -35.6% | $9,000 -28.7% |
| 2020 | $2,820 -2.4% | $12,629 -12% |
| 2019 | $2,891 +1.7% | $14,352 |
| 2018 | $2,842 +712.4% | $14,352 -30.8% |
| 2017 | $350 -54.8% | $20,726 |
| 2016 | $774 +4% | $20,726 |
| 2015 | $744 +0.9% | $20,726 +2.6% |
| 2014 | $737 -0.3% | $20,196 |
| 2013 | $740 +6.8% | $20,196 |
| 2012 | $693 -1.1% | $20,196 -9.9% |
| 2011 | $700 +10.6% | $22,420 |
| 2010 | $633 +6.6% | $22,420 |
| 2009 | $594 -7.5% | $22,420 -9.6% |
| 2008 | $642 -68.7% | $24,796 |
| 2007 | $2,051 +170.1% | $24,796 |
| 2006 | $759 -66.7% | $24,796 +39.1% |
| 2005 | $2,282 +11.3% | $17,823 |
| 2004 | $2,051 +3.4% | $17,823 |
| 2003 | $1,984 +72.2% | $17,823 +23.6% |
| 2002 | $1,152 -6.6% | $14,417 |
| 2001 | $1,233 -8.7% | $14,417 |
| 2000 | $1,351 +35.1% | $14,417 +20.6% |
| 1999 | $1,000 | $11,956 |
Find assessor info on the county website
Monthly payment
Est. payment
Payment breakdown
Explore the cost of this home by adjusting the details. Changes won't be saved.Climate risks
Neighborhood: Rosemoor
Nearby schools

Similar homes
- $--5 bd2 ba2.1k sqft11317 S Indiana Ave, Chicago, IL 60628Auction
 Auction.com 2
- $--6 bd2 ba2.2k sqft10125 S State St #2, Chicago, IL 60628Auction
 Xome
- $--4 bd2 ba2k sqft10239 S Yale Ave, Chicago, IL 60628Auction
 ServiceLink Auction
- $--7 bd3 ba3.8k sqft11247 S King Dr, Chicago, IL 60628Auction
 Auction.com 2
