$142,000
2 bd|2 ba|835 sqft
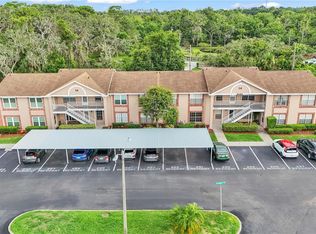
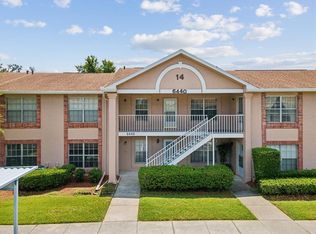
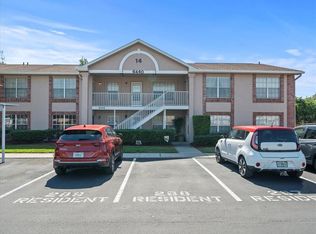
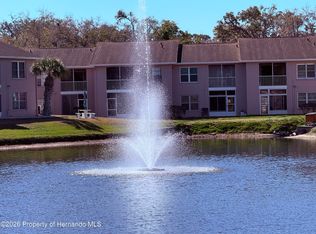
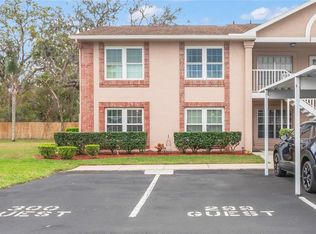
6440 Spring Flower Dr UNIT 11, New Port Richey, FL 34653
Sold
Likely to sell faster than
Zillow last checked:
Listing updated:
Gena McCulloch 727-753-8731,
Real Broker, LLC
$131,600
$125,000 - $138,000
$1,280/mo
| Date | Event | Price |
|---|---|---|
| 6/20/2026 | Price change | $132,500-1.9%$159/sqft |
Source: | ||
| 6/2/2026 | Price change | $135,000-3.6%$162/sqft |
Source: | ||
| 3/26/2026 | Price change | $140,000-3.4%$168/sqft |
Source: | ||
| 1/31/2026 | Price change | $145,000-3.3%$174/sqft |
Source: | ||
| 10/29/2025 | Price change | $149,999-6.3%$180/sqft |
Source: | ||
| 10/10/2025 | Listed for sale | $160,000+3.2%$192/sqft |
Source: | ||
| 8/24/2025 | Listing removed | $155,000$186/sqft |
Source: | ||
| 4/13/2025 | Price change | $155,000-3.1%$186/sqft |
Source: | ||
| 3/11/2025 | Listed for sale | $160,000-5.9%$192/sqft |
Source: Owner Report a problem | ||
| 8/5/2024 | Listing removed | -- |
Source: | ||
| 11/20/2023 | Price change | $170,000-10.5%$204/sqft |
Source: | ||
| 11/1/2023 | Price change | $189,900-5%$227/sqft |
Source: | ||
| 10/22/2023 | Listed for sale | $199,900+121.6%$239/sqft |
Source: | ||
| 9/20/2021 | Sold | $90,200+48.5%$108/sqft |
Source: Public Record Report a problem | ||
| 11/30/2017 | Sold | $60,750-7.8%$73/sqft |
Source: Stellar MLS #W7632827 Report a problem | ||
| 11/7/2017 | Pending sale | $65,900$79/sqft |
Source: CENTURY 21 Professional Realty #W7632827 Report a problem | ||
| 10/20/2017 | Price change | $65,900-5.7%$79/sqft |
Source: CENTURY 21 Professional Realty #W7632827 Report a problem | ||
| 8/14/2017 | Listed for sale | $69,900$84/sqft |
Source: CENTURY 21 PROFESSIONAL REALTY #W7632827 Report a problem | ||
| Year | Property taxes | Tax assessment |
|---|---|---|
| 2024 | $2,691 +9.9% | $129,822 +34.3% |
| 2023 | $2,449 +18.9% | $96,630 +22.7% |
| 2022 | $2,059 +23.7% | $78,727 +27.9% |
| 2021 | $1,664 +5.7% | $61,540 +10% |
| 2020 | $1,575 +9.9% | $55,950 +10% |
| 2019 | $1,433 | $50,868 -1.3% |
| 2018 | $1,433 -1.5% | $51,542 +23.1% |
| 2017 | $1,454 +24.2% | $41,875 +23% |
| 2016 | $1,170 +18.9% | $34,045 +1.6% |
| 2015 | $984 +4.3% | $33,520 +5.4% |
| 2014 | $944 | $31,809 +2.2% |
| 2013 | -- | $31,119 -5.1% |
| 2012 | -- | $32,792 -1.1% |
| 2011 | -- | $33,166 -16% |
| 2010 | -- | $39,474 -28.3% |
| 2009 | -- | $55,025 -10% |
| 2008 | -- | $61,148 -27.7% |
| 2007 | -- | $84,518 +17.4% |
| 2006 | -- | $71,961 +33.3% |
| 2005 | -- | $53,995 +28.4% |
| 2004 | -- | $42,036 +5.6% |
| 2003 | -- | $39,797 +7.9% |
| 2002 | -- | $36,897 +6.2% |
| 2000 | -- | $34,751 +6.7% |
| 1999 | -- | $32,565 |
Find assessor info on the county website
A local agent can set up tours, give advice and negotiate with sellers.