BUILDER'S SPECIAL. HOUSE IN NEED OF COMPLETE GUT. 2ND FLOOR IS FRAMED FOR A 2ND FULL BATH, FLANKED BY TWO BEDROOMS.
Pending
$579,000
65 Montvale St, Roslindale, MA 02131
3beds
1,672sqft
Single Family Residence
Built in 1965
5,000 Square Feet Lot
$576,100 Zestimate®
$346/sqft
$-- HOA
What's special
- 37 days
- 265
- 7
Likely to sell faster than
Zillow last checked:
Listing updated:
Listed by:
Steven Musto 617-892-5888,
Insight Realty Group, Inc. 617-323-2300
Source: MLS PIN,MLS#: 73577250
Facts & features
Interior
Bedrooms & bathrooms
- Bedrooms: 3
- Bathrooms: 2
- Full bathrooms: 2
Primary bathroom
- Features: No
Heating
- Natural Gas
Cooling
- None
Features
- Basement: Full
- Number of fireplaces: 1
Interior area
- Total structure area: 1,672
- Total interior livable area: 1,672 sqft
- Finished area above ground: 1,672
Property
Parking
- Total spaces: 2
- Parking features: Garage
- Garage spaces: 1
- Uncovered spaces: 1
Lot
- Size: 5,000 Square Feet
- Features: Cleared
Details
- Parcel number: 1389524
- Zoning: 2F-5000
Construction
Type & style
- Home type: SingleFamily
- Architectural style: Cape
- Property subtype: Single Family Residence
Materials
- Foundation: Concrete Perimeter
Condition
- Year built: 1965
Utilities & green energy
- Sewer: Public Sewer
- Water: Public
Community & HOA
HOA
- Has HOA: No
Location
- Region: Roslindale
Financial & listing details
- Price per square foot: $346/sqft
- Tax assessed value: $627,200
- Annual tax amount: $7,777
- Date on market: 9/15/2026
Estimated market value
$576,100
$547,000 - $605,000
$2,851/mo
Price history
| Date | Event | Price |
|---|---|---|
| 10/8/2026 | Pending sale | $579,000$346/sqft |
Source: MLS PIN #73577250 Report a problem | ||
| 9/24/2026 | Contingent | $579,000$346/sqft |
Source: MLS PIN #73577250 Report a problem | ||
| 9/15/2026 | Listed for sale | $579,000$346/sqft |
Source: MLS PIN #73577250 Report a problem | ||
Public tax history
| Year | Property taxes | Tax assessment |
|---|---|---|
| 2025 | $6,918 +14.9% | $597,400 +8.1% |
| 2024 | $6,022 +6.6% | $552,500 +5% |
| 2023 | $5,649 +10.5% | $526,000 +12% |
| 2022 | $5,110 +9.8% | $469,700 +7.6% |
| 2021 | $4,656 +2.6% | $436,400 +1.6% |
| 2020 | $4,537 +7.2% | $429,600 +6.9% |
| 2019 | $4,234 +8.6% | $401,700 +8% |
| 2018 | $3,899 +790.7% | $372,000 +7% |
| 2017 | $438 -88.2% | $347,700 +3% |
| 2016 | $3,713 +10.3% | $337,500 +21.4% |
| 2015 | $3,365 +6.1% | $277,900 +10.2% |
| 2014 | $3,171 -4.3% | $252,100 |
| 2013 | $3,313 -0.8% | $252,100 -1.6% |
| 2012 | $3,341 +2% | $256,200 |
| 2011 | $3,277 +6.6% | $256,200 -1% |
| 2010 | $3,075 +8.7% | $258,800 -2.8% |
| 2009 | $2,830 -5.6% | $266,200 -2.6% |
| 2008 | $2,998 -6.5% | $273,300 -6.3% |
| 2007 | $3,207 | $291,800 |
Find assessor info on the county website
Monthly payment
Est. payment
Payment breakdown
Explore the cost of this home by adjusting the details. Changes won't be saved.Climate risks
Neighborhood: Roslindale
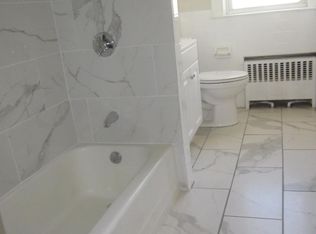


Similar homes
- $674,9003 bd2 ba1.3k sqft32 Aldrich St, Roslindale, MA 02131For Sale
 MLS ID #73587792, Kate Duggan, Bostonia Properties. MLS PIN
- $529,0003 bd2 ba1.2k sqft57-59 Hemman Street Condominium, Roslindale, MA 02131For Sale
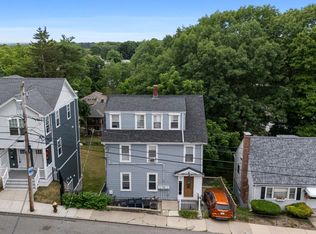 MLS ID #73547324, Phaedra Udor, MIG. MLS PIN
- $649,0003 bd2 ba1.6k sqft7 Franklin St, Hyde Park, MA 02136For Sale
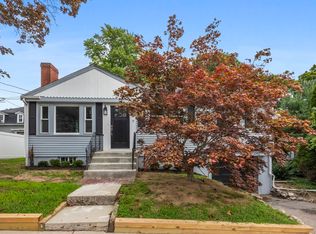 MLS ID #73570025, Jonathan Batchelder, Wallace Property Company. MLS PIN
- $585,0004 bd2 ba1.3k sqft181 West St, Quincy, MA 02169For Sale
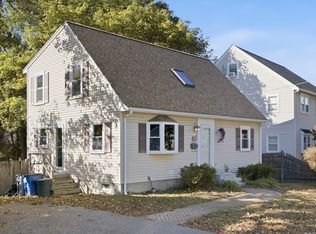 MLS ID #73592439, Madelene Cheney, Red Door Real Estate. MLS PIN
