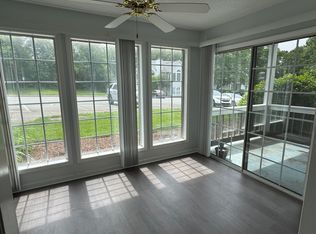
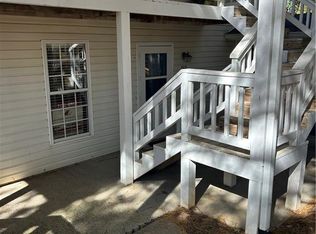
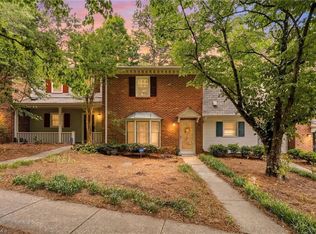
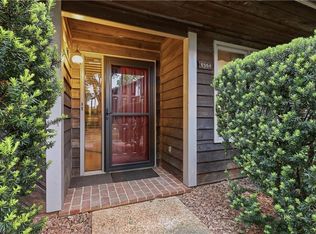
$175,400
2 bd|2 ba|1.2k sqft
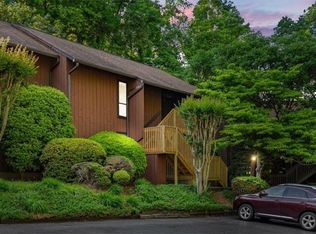
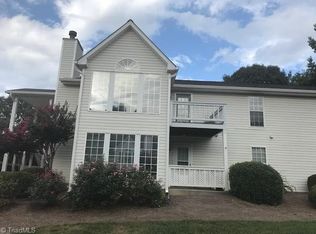
659 Balfour Rd, Winston Salem, NC 27104
Off Market
Zillow last checked:
Listing updated:
Julia Groza 919-349-3274,
Real Broker LLC
$193,400
$184,000 - $203,000
$1,491/mo
| Date | Event | Price |
|---|---|---|
| 6/18/2026 | Listed for sale | $200,000-4.8% |
Source: | ||
| 6/14/2026 | Price change | $1,595+23.2%$1/sqft |
Source: Zillow Rentals Report a problem | ||
| 5/18/2026 | Listing removed | $210,000 |
Source: | ||
| 5/18/2026 | Listed for rent | $1,295-7.2%$1/sqft |
Source: Zillow Rentals Report a problem | ||
| 3/26/2026 | Listed for sale | $210,000+37.3% |
Source: | ||
| 3/25/2025 | Listing removed | $1,395$1/sqft |
Source: Zillow Rentals Report a problem | ||
| 12/18/2024 | Listed for rent | $1,395$1/sqft |
Source: Zillow Rentals Report a problem | ||
| 4/23/2024 | Listing removed | -- |
Source: Zillow Rentals Report a problem | ||
| 4/21/2024 | Listed for rent | $1,395$1/sqft |
Source: Zillow Rentals Report a problem | ||
| 10/16/2023 | Sold | $153,000-6.7% |
Source: | ||
| 9/10/2023 | Pending sale | $164,000 |
Source: | ||
| 8/30/2023 | Price change | $164,000-3.5% |
Source: | ||
| 8/15/2023 | Price change | $170,000-2.8% |
Source: | ||
| 8/3/2023 | Listed for sale | $174,900+140.7% |
Source: | ||
| 6/9/2011 | Sold | $72,650-9.1% |
Source: | ||
| 3/1/2011 | Price change | $79,900-0.1%$62/sqft |
Source: AmeriKas Realty Team #563071 Report a problem | ||
| 8/28/2010 | Listed for sale | $80,000-5.9%$63/sqft |
Source: AmeriKas Realty #563071 Report a problem | ||
| 2/14/2010 | Listing removed | $85,000$66/sqft |
Source: AmeriKas Realty #563071 Report a problem | ||
| 12/5/2009 | Listed for sale | $85,000+7.6%$66/sqft |
Source: AmeriKas Realty #563071 Report a problem | ||
| 8/24/2009 | Sold | $79,000-25.1%$62/sqft |
Source: Public Record Report a problem | ||
| 6/15/2007 | Sold | $105,500+21.3% |
Source: | ||
| 12/21/1998 | Sold | $87,000+7.4% |
Source: | ||
| 10/29/1997 | Sold | $81,000 |
Source: | ||
| Year | Property taxes | Tax assessment |
|---|---|---|
| 2025 | $1,933 +52.1% | $175,400 +93.6% |
| 2024 | $1,271 +4.8% | $90,600 |
| 2023 | $1,213 +1.9% | $90,600 |
| 2022 | $1,190 +1.8% | $90,600 |
| 2021 | $1,169 +9.1% | $90,600 +16.8% |
| 2020 | $1,072 -0.7% | $77,600 |
| 2019 | $1,079 +5.3% | $77,600 |
| 2018 | $1,025 | $77,600 +1.8% |
| 2016 | $1,025 +3.8% | $76,242 |
| 2015 | $988 +3.1% | $76,242 |
| 2014 | $958 | $76,242 |
| 2013 | -- | $76,242 -22.9% |
| 2012 | -- | $98,854 |
| 2011 | -- | $98,854 |
| 2010 | -- | $98,854 |
| 2009 | -- | $98,854 +2.8% |
| 2008 | -- | $96,141 |
| 2007 | -- | $96,141 |
| 2006 | -- | $96,141 |
| 2005 | -- | $96,141 +5.7% |
| 2004 | -- | $90,975 |
| 2003 | -- | $90,975 |
| 2002 | -- | $90,975 |
| 2001 | -- | $90,975 +23.1% |
| 2000 | -- | $73,889 |
Find assessor info on the county website
Source: Triad MLS. This data may not be complete. We recommend contacting the local school district to confirm school assignments for this home.
A local agent can set up tours, give advice and negotiate with sellers.
A local lender can help you make sure your offer is ready when you are.