CONVENTIONAL THREE FAMILY 5,5,5. ALL UNITS HAVE TWO BEDROOMS, LIVING ROOM, DINING ROOM, KITCHEN AND ONE BATH. OFF STREET PARKING. HOUSE TO BE SOLD "SIGHT UNSEEN". PROPERTY TO BE SOLD WITH TENANT. PROPERTY BEING SOLD "AS IS". PLEASE DO NOT BOTHER TENANTS. SEE DISCLOSURES. CASH OFFERS ONLY.
Pending
$399,000
66 Harwood St, Lynn, MA 01902
6beds
2,875sqft
3 Family
Built in 1890
-- sqft lot
$769,500 Zestimate®
$139/sqft
$-- HOA
What's special
- 144 days
- 19
- 0
Zillow last checked:
Listing updated:
Listed by:
Delia Quintana 781-589-8229,
Stonehurst Real Estate Group 781-808-7106,
Delia Quintana 781-589-8229
Source: MLS PIN,MLS#: 72115676
Facts & features
Interior
Bedrooms & bathrooms
- Bedrooms: 6
- Bathrooms: 3
- Full bathrooms: 3
Heating
- Natural Gas
Features
- Basement: Full
- Has fireplace: No
Interior area
- Total structure area: 2,875
- Total interior livable area: 2,875 sqft
Property
Parking
- Total spaces: 3
- Parking features: Paved Drive, Off Street
- Uncovered spaces: 3
Lot
- Size: 3,371 Square Feet
Details
- Foundation area: 0
- Parcel number: M:053 B:724 L:009,2005798
- Zoning: R4
Construction
Type & style
- Home type: MultiFamily
- Property subtype: 3 Family
Materials
- Foundation: Stone, Brick/Mortar
Condition
- Year built: 1890
Utilities & green energy
- Sewer: Public Sewer
- Water: Public
Community & HOA
Location
- Region: Lynn
Financial & listing details
- Price per square foot: $139/sqft
- Tax assessed value: $352,800
- Annual tax amount: $5,504
- Date on market: 5/30/2026
- Exclusions: Tenants Personal Belongings.
- Total actual rent: 4065
Estimated market value
$769,500
$623,000 - $923,000
$3,604/mo
Price history
| Date | Event | Price |
|---|---|---|
| 9/23/2026 | Pending sale | $399,000+232.5%$139/sqft |
Source: MLS PIN #72115676 Report a problem | ||
| 6/14/2023 | Listing removed | $120,000$42/sqft |
Source: MLS PIN #73122027 Report a problem | ||
| 6/7/2023 | Listed for sale | $120,000-73.5%$42/sqft |
Source: MLS PIN #73122027 Report a problem | ||
| 2/19/2020 | Listing removed | $452,673$157/sqft |
Source: Auction.com Report a problem | ||
| 12/24/2019 | Price change | $452,673-24.6%$157/sqft |
Source: Auction.com Report a problem | ||
| 12/5/2019 | Price change | $600,000-4.8%$209/sqft |
Source: Allen Realty Company #72596539 Report a problem | ||
| 11/27/2019 | Price change | $630,000+39.2%$219/sqft |
Source: Allen Realty Company #72596539 Report a problem | ||
| 11/26/2019 | Price change | $452,5850%$157/sqft |
Source: Auction.com Report a problem | ||
| 11/25/2019 | Price change | $452,606+13.4%$157/sqft |
Source: Auction.com Report a problem | ||
| 11/22/2019 | Listed for sale | -- |
Source: Auction.com Report a problem | ||
| 6/5/2017 | Listing removed | $399,000$139/sqft |
Source: Stonehurst Real Estate Group #72115676 Report a problem | ||
| 5/22/2017 | Pending sale | $399,000$139/sqft |
Source: Stonehurst Real Estate Group #72115676 Report a problem | ||
| 2/27/2017 | Price change | $399,000-13.3%$139/sqft |
Source: Stonehurst Real Estate Group #72115676 Report a problem | ||
| 2/3/2017 | Listed for sale | $460,000+61.4%$160/sqft |
Source: Stonehurst Real Estate Group #72115676 Report a problem | ||
| 9/6/2007 | Sold | $285,000-39.5%$99/sqft |
Source: Public Record Report a problem | ||
| 6/6/2006 | Sold | $471,203+4.7%$164/sqft |
Source: Public Record Report a problem | ||
| 6/1/2004 | Sold | $449,900+36.3%$156/sqft |
Source: Public Record Report a problem | ||
| 1/22/2004 | Sold | $330,000$115/sqft |
Source: Public Record Report a problem | ||
Public tax history
| Year | Property taxes | Tax assessment |
|---|---|---|
| 2025 | $7,974 +0.1% | $769,700 +1.7% |
| 2024 | $7,966 +8.9% | $756,500 +15.3% |
| 2023 | $7,317 | $656,200 |
| 2022 | $7,317 +5.6% | $656,200 +23.4% |
| 2021 | $6,931 +5.3% | $531,900 +8.3% |
| 2020 | $6,583 +5.1% | $491,300 +12.2% |
| 2019 | $6,263 +8.3% | $438,000 +14.8% |
| 2018 | $5,781 +5% | $381,600 +8.2% |
| 2017 | $5,504 +12.1% | $352,800 +16.2% |
| 2016 | $4,911 +10.9% | $303,500 +14.7% |
| 2015 | $4,430 +11.2% | $264,500 +13.7% |
| 2014 | $3,984 +9.4% | $232,600 +8.1% |
| 2013 | $3,642 +1.1% | $215,100 -2.8% |
| 2012 | $3,601 +1% | $221,200 +0.6% |
| 2011 | $3,565 +10.6% | $219,800 +5.9% |
| 2010 | $3,222 -9.1% | $207,500 -25.4% |
| 2009 | $3,546 -13.4% | $278,300 -25.4% |
| 2008 | $4,097 +10.4% | $373,100 -0.1% |
| 2006 | $3,711 0% | $373,300 +2.4% |
| 2005 | $3,712 +1.1% | $364,600 +13.5% |
| 2004 | $3,671 +9.5% | $321,200 +26.5% |
| 2003 | $3,354 +84.9% | $253,900 +130.4% |
| 2001 | $1,814 +21.3% | $110,200 +30.7% |
| 1999 | $1,495 -12.4% | $84,300 -17.2% |
| 1995 | $1,706 | $101,800 |
Find assessor info on the county website
Monthly payment
Est. payment
Payment breakdown
Explore the cost of this home by adjusting the details. Changes won't be saved.Climate risks
Neighborhood: 01902

Similar homes
- $--3 bd1 ba1.7k sqft81 Jackson St, Lynn, MA 01902Auction
 Auction.com 4
- $399,9995 bd3 ba2.5k sqft70 J St, Hull, MA 02045For Sale
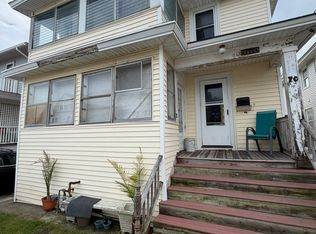 MLS ID #73592300, Catherine Walsh, Coldwell Banker Realty - Easton. MLS PIN
- $499,9003 bd2 ba1.4k sqft347 Western Ave, Lynn, MA 01904For Sale
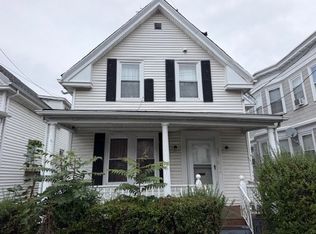 MLS ID #73582943, Evan Russell, Century 21 North East. MLS PIN
- $399,0006 bd6 ba3k sqft7 Princeton St, Boston, MA 02128For Sale
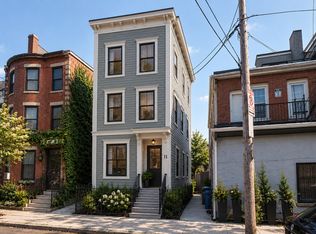 MLS ID #73587148, Jorge Rodriguez, Carlton's Wharf & Co.. MLS PIN
