$39,060
3,125 Square Feet
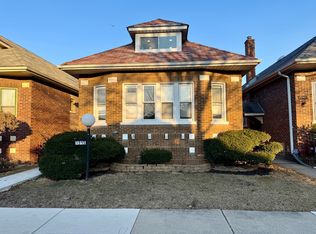
6951 S Indiana Ave, Chicago, IL 60637
Off Market

Zillow last checked:
Listing updated:
Yanira Doyle 815-221-8400,
Century 21 IMPACT
$279,800
$266,000 - $294,000
$2,663/mo
| Date | Event | Price |
|---|---|---|
| 6/16/2026 | Price change | $280,000-3.4%$140/sqft |
Source: MRED as distributed by MLS GRID #12546095 Report a problem | ||
| 3/30/2026 | Price change | $290,000-1.7%$145/sqft |
Source: | ||
| 3/10/2026 | Listed for sale | $295,000+212.2%$148/sqft |
Source: | ||
| 9/19/2023 | Sold | $94,500-0.5%$47/sqft |
Source: | ||
| 3/10/2020 | Sold | $95,000+97.9%$48/sqft |
Source: Public Record Report a problem | ||
| 2/14/2020 | Listing removed | $1,500$1/sqft |
Source: GC Realty & Development, LLC Report a problem | ||
| 1/21/2020 | Listed for rent | $1,500$1/sqft |
Source: Zillow Rental Network Report a problem | ||
| 10/15/2019 | Sold | $48,000-7.7%$24/sqft |
Source: | ||
| 9/20/2019 | Pending sale | $52,000$26/sqft |
Source: Chicago Area Realty Inc #10508220 Report a problem | ||
| 9/5/2019 | Price change | $52,000-5.3%$26/sqft |
Source: Chicago Area Realty Inc #10508220 Report a problem | ||
| 8/28/2019 | Pending sale | $54,900$27/sqft |
Source: Chicago Area Realty Inc #10508220 Report a problem | ||
| 8/23/2019 | Price change | $54,900-8.3%$27/sqft |
Source: Chicago Area Realty Inc #10508220 Report a problem | ||
| 7/31/2019 | Listed for sale | $59,900$30/sqft |
Source: Chicago Area Realty Inc #10508220 Report a problem | ||
| Year | Property taxes | Tax assessment |
|---|---|---|
| 2024 | -- | $24,000 +269.3% |
| 2023 | $1,371 +2.6% | $6,499 |
| 2022 | $1,337 +2.3% | $6,499 |
| 2021 | $1,307 -57.6% | $6,499 -53% |
| 2020 | $3,080 +28.5% | $13,828 -10% |
| 2019 | $2,398 +1.8% | $15,365 |
| 2018 | $2,357 +24.9% | $15,365 +26.5% |
| 2017 | $1,887 -2.3% | $12,142 |
| 2016 | $1,932 +10.7% | $12,142 |
| 2015 | $1,744 +11.7% | $12,142 +10.5% |
| 2014 | $1,562 +2.8% | $10,985 |
| 2013 | $1,520 -0.3% | $10,985 |
| 2012 | $1,524 -7.1% | $10,985 -19.3% |
| 2011 | $1,641 +15% | $13,617 |
| 2010 | $1,427 +17.4% | $13,617 |
| 2009 | $1,216 -9.4% | $13,617 -15.3% |
| 2008 | $1,342 +17.1% | $16,070 |
| 2007 | $1,146 +0.8% | $16,070 |
| 2006 | $1,137 -5.1% | $16,070 +47.4% |
| 2005 | $1,199 +1.9% | $10,900 |
| 2004 | $1,176 +4.5% | $10,900 |
| 2003 | $1,126 -5.4% | $10,900 +29% |
| 2002 | $1,191 +7% | $8,450 |
| 2001 | $1,113 +16.3% | $8,450 |
| 2000 | $957 | $8,450 +21.1% |
| 1999 | -- | $6,979 |
Find assessor info on the county website
Source: MRED as distributed by MLS GRID. This data may not be complete. We recommend contacting the local school district to confirm school assignments for this home.
A local agent can set up tours, give advice and negotiate with sellers.
A local lender can help you make sure your offer is ready when you are.