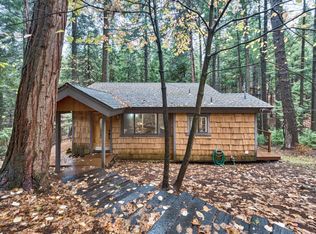
FEELS LIKE A TREE HOUSE! Single story FIXER with 2 bedrooms, a possible 3rd, and 2 full baths. Propane stove. Tile floors. Dual pane windows. Rear deck among towering trees. REPAIRS, PAINT & NEW CARPET UNDERWAY!<br><br>--------------------------------------------------------------------------------<br><br/><br/>Brokered And Advertised By: ERA Realty Center<br/>Listing Agent: Chris and Janet Gaut
Pre-foreclosure
Street View
Est. $326,500
7176 Pine Cone Dr, Pollock Pines, CA 95726
3beds
2baths
1,152sqft
SingleFamily
Built in 1980
0.32 Acres Lot
$326,500 Zestimate®
$283/sqft
$-- HOA
Overview
- 35 days
- 10
- 2
Facts & features
Interior
Bedrooms & bathrooms
- Bedrooms: 3
- Bathrooms: 2
Features
- Has fireplace: Yes
Interior area
- Total interior livable area: 1,152 sqft
Property
Lot
- Size: 0.32 Acres
Details
- Parcel number: 042552006000
Construction
Type & style
- Home type: SingleFamily
Materials
- wood frame
Condition
- Year built: 1980
Community & HOA
Location
- Region: Pollock Pines
Financial & listing details
- Price per square foot: $283/sqft
- Tax assessed value: $165,875
Foreclosure details
Estimated market value
$326,500
$300,000 - $349,000
$2,463/mo
Price history
| Date | Event | Price |
|---|---|---|
| 2/16/2010 | Sold | $126,000+10.6%$109/sqft |
Source: MetroList Services of CA #90082196 Report a problem | ||
| 11/28/2009 | Price change | $113,900-5%$99/sqft |
Source: foreclosure.com Report a problem | ||
| 11/1/2009 | Price change | $119,900-17.3%$104/sqft |
Source: foreclosure.com Report a problem | ||
| 10/10/2009 | Listed for sale | -- |
Source: foreclosure.com Report a problem | ||
| 9/16/2009 | Sold | $145,000-37%$126/sqft |
Source: Public Record Report a problem | ||
| 7/22/2004 | Sold | $230,000+47.4%$200/sqft |
Source: MetroList Services of CA #40016399 Report a problem | ||
| 6/12/2001 | Sold | $156,000$135/sqft |
Source: MetroList Services of CA #122101337 Report a problem | ||
Public tax history
| Year | Property taxes | Tax assessment |
|---|---|---|
| 2026 | -- | $165,875 +2% |
| 2025 | $2,416 +8.2% | $162,623 +2% |
| 2024 | $2,233 +34.4% | $159,435 +2% |
| 2023 | $1,661 +1.6% | $156,309 +2% |
| 2022 | $1,636 +1.1% | $153,245 +2% |
| 2021 | $1,617 +1.4% | $150,241 +1% |
| 2020 | $1,594 +1.6% | $148,701 +2% |
| 2019 | $1,570 +3.4% | $145,786 +2% |
| 2018 | $1,518 +3.1% | $142,929 +2% |
| 2017 | $1,473 +1.6% | $140,128 +2% |
| 2016 | $1,451 +2.4% | $137,381 +1.5% |
| 2015 | $1,417 | $135,319 +2% |
| 2014 | $1,417 | $132,669 +0.5% |
| 2013 | -- | $132,072 +4% |
| 2012 | -- | $126,948 |
| 2011 | -- | $126,948 +1.2% |
| 2010 | -- | $125,500 -33.4% |
| 2009 | -- | $188,500 -22.8% |
| 2008 | -- | $244,077 +2% |
| 2007 | -- | $239,292 +2% |
| 2006 | -- | $234,600 +2% |
| 2005 | -- | $230,000 +39.1% |
| 2004 | -- | $165,330 +1.9% |
| 2003 | -- | $162,302 +2% |
| 2002 | -- | $159,120 |
Find assessor info on the county website
Monthly payment
Climate risks
Neighborhood: 95726
Similar homes
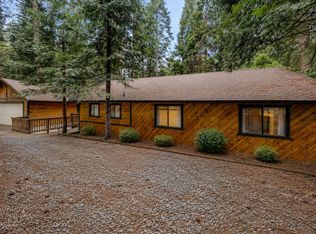
- $350,0003 bd3 ba1.5k sqft7058 Lakewood Dr, Pollock Pines, CA 95726For Sale
 MLS ID #226111963, Brenda Holloway-Donegan. MetroList Services of CA
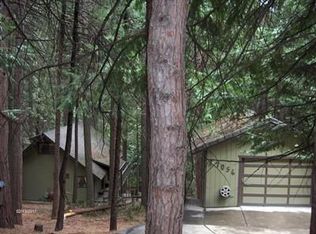
- $--3 bd2 ba1k sqft6224 Pine St, Pollock Pines, CA 95726Auction
 Xome
- $386,0003 bd2 ba1.4k sqft4250 Kingswood Trl, Pollock Pines, CA 95726For Sale
 MLS ID #226133960, Jill Gardner. MetroList Services of CA
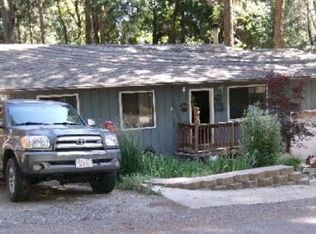
- $344,9004 bd2 ba1.2k sqft3220 Sly Park Rd, Pollock Pines, CA 95726For Sale
 MLS ID #226126250, James Peterson. MetroList Services of CA
