$222,300
3 bd|2 ba|1.6k sqft
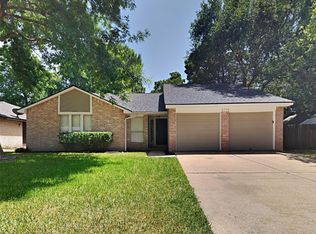
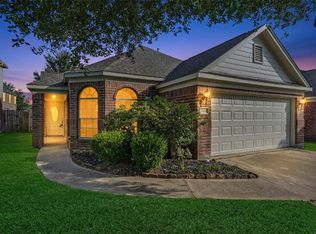
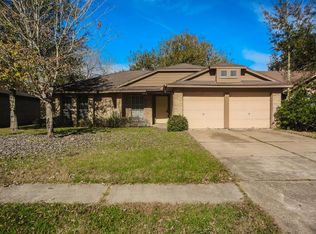
7207 Fuchsia Ln, Humble, TX 77346
Off Market
Zillow last checked:
Listing updated:
Bea Flores 832-623-2121,
Sovereign Real Estate Grp
$233,700
$222,000 - $245,000
$2,186/mo
| Date | Event | Price |
|---|---|---|
| 6/29/2026 | Pending sale | $240,000$125/sqft |
Source: | ||
| 5/1/2026 | Price change | $240,000-4%$125/sqft |
Source: | ||
| 3/7/2026 | Listed for sale | $250,000+22%$130/sqft |
Source: | ||
| 1/15/2026 | Listing removed | $2,095$1/sqft |
Source: Zillow Rentals Report a problem | ||
| 1/14/2026 | Price change | $2,095-0.9%$1/sqft |
Source: Zillow Rentals Report a problem | ||
| 1/6/2026 | Price change | $2,115-0.9%$1/sqft |
Source: Zillow Rentals Report a problem | ||
| 12/22/2025 | Listed for rent | $2,135+15.1%$1/sqft |
Source: Zillow Rentals Report a problem | ||
| 5/2/2023 | Listing removed | -- |
Source: Zillow Rentals Report a problem | ||
| 4/27/2023 | Price change | $1,855-2.1%$1/sqft |
Source: Zillow Rentals Report a problem | ||
| 4/22/2023 | Price change | $1,895-2.6%$1/sqft |
Source: Zillow Rentals Report a problem | ||
| 3/26/2023 | Listed for rent | $1,945-0.3%$1/sqft |
Source: Zillow Rentals Report a problem | ||
| 3/25/2023 | Listing removed | -- |
Source: Zillow Rentals Report a problem | ||
| 2/1/2023 | Price change | $1,950+7.4%$1/sqft |
Source: Zillow Rentals Report a problem | ||
| 1/24/2023 | Listed for rent | $1,815+7.1%$1/sqft |
Source: Zillow Rentals Report a problem | ||
| 12/8/2021 | Listing removed | -- |
Source: | ||
| 11/11/2021 | Pending sale | $205,000$107/sqft |
Source: | ||
| 11/6/2021 | Listed for sale | $205,000+29.8%$107/sqft |
Source: | ||
| 6/1/2021 | Listing removed | -- |
Source: Zillow Rental Network Premium Report a problem | ||
| 5/19/2021 | Listed for rent | $1,695+30.9%$1/sqft |
Source: Zillow Rental Network Premium Report a problem | ||
| 12/15/2018 | Listing removed | $1,295$1/sqft |
Source: BRS Report a problem | ||
| 11/30/2018 | Price change | $1,295-3.7%$1/sqft |
Source: BRS Report a problem | ||
| 11/22/2018 | Price change | $1,345-3.6%$1/sqft |
Source: BRS Report a problem | ||
| 11/14/2018 | Price change | $1,395-15.5%$1/sqft |
Source: BRS Report a problem | ||
| 10/9/2018 | Listed for rent | $1,650$1/sqft |
Source: BRS Report a problem | ||
| 6/10/2018 | Listing removed | $157,900$82/sqft |
Source: Aim Realty #54401428 Report a problem | ||
| 6/9/2018 | Sold | -- |
Source: Agent Provided Report a problem | ||
| Year | Property taxes | Tax assessment |
|---|---|---|
| 2025 | $1,912 +9.1% | $229,000 +6.7% |
| 2024 | $1,752 +4.5% | $214,687 -4.9% |
| 2023 | $1,677 +13.4% | $225,782 +13.5% |
| 2022 | $1,478 | $198,921 +16.8% |
| 2021 | -- | $170,360 +3.6% |
| 2020 | $1,335 +7.4% | $164,448 +9.1% |
| 2019 | $1,243 -61.8% | $150,777 +33.4% |
| 2018 | $3,252 | $112,989 -7.8% |
| 2017 | $3,252 -1.6% | $122,570 -3.2% |
| 2016 | $3,303 +68.9% | $126,615 +23.3% |
| 2015 | $1,955 | $102,715 -5.3% |
| 2014 | $1,955 | $108,409 +10.8% |
| 2013 | -- | $97,885 |
| 2012 | -- | $97,885 |
| 2011 | -- | $97,885 |
| 2010 | -- | $97,885 -4.3% |
| 2009 | -- | $102,316 -2.4% |
| 2007 | -- | $104,834 +3.7% |
| 2006 | -- | $101,100 |
| 2005 | -- | $101,100 |
| 2004 | -- | $101,100 +2% |
| 2003 | -- | $99,100 +9.5% |
| 2002 | -- | $90,500 +4.1% |
| 2001 | -- | $86,900 +6.4% |
| 2000 | -- | $81,700 |
Find assessor info on the county website
Source: HAR. This data may not be complete. We recommend contacting the local school district to confirm school assignments for this home.
A local agent can set up tours, give advice and negotiate with sellers.
A local lender can help you make sure your offer is ready when you are.