Move In Ready centrally located off of Orient Rd., I-4, schools. Short drive to Brandon or Downtown Tampa. This is a cozy 3 bed, 1 bath with the master suite downstairs and two rooms upstairs. Well laid out MODERN KITCHEN with separate dining and living room. Plenty of storage. Outside enjoy the evenings on front enclosed porch or rear deck. Plus, this is a SOUGHT AFTER LARGE LOT with plenty of parking and STORAGE SPACE and access to back and sides of property. Be sure to CHECK OUT the 3D VIRTUAL TOUR - See link!
Pre-foreclosure
Est. $310,900
7211 Waycross Ave, Tampa, FL 33619
3beds
1,216sqft
Single Family Residence
Built in 1946
9,448 Square Feet Lot
$310,900 Zestimate®
$256/sqft
$-- HOA
Overview
- 231 days
- 12
- 1
Originating MLS: Pinellas Suncoast
Facts & features
Interior
Bedrooms & bathrooms
- Bedrooms: 3
- Bathrooms: 1
- Full bathrooms: 1
Heating
- Forced air, Other
Cooling
- Central
Appliances
- Included: Dishwasher, Range / Oven, Refrigerator
Features
- Master Bedroom Downstairs, Living Room/Dining Room Combo, Window Treatments
- Flooring: Tile, Laminate
Interior area
- Structure area source: Public Records
- Total interior livable area: 1,216 sqft
Property
Parking
- Parking features: Off-street
Features
- Levels: Two
- Patio & porch: Deck, Porch, Screened
- Exterior features: Wood
Lot
- Size: 9,448 Square Feet
- Dimensions: 90x105
- Features: Street Paved
- Residential vegetation: Mature Landscaping
Details
- Parcel number: 1929111N5000003000250U
- Zoning: RSC-9
Construction
Type & style
- Home type: SingleFamily
- Architectural style: Traditional
- Property subtype: Single Family Residence
Materials
- masonry
- Roof: Other
Condition
- Completed
- Year built: 1946
Utilities & green energy
- Sewer: Public Sewer, Septic Tank
- Water: Public
- Utilities for property: Electricity Available
Community & HOA
Community
- Subdivision: UCETA HEIGHTS
Location
- Region: Tampa
Financial & listing details
- Price per square foot: $256/sqft
- Tax assessed value: $245,577
- Annual tax amount: $3,967
- Listing terms: Cash, Conventional, FHA, VA Loan
- Ownership: Fee Simple
Foreclosure details
Estimated market value
$310,900
$292,000 - $326,000
$2,058/mo
Price history
| Date | Event | Price |
|---|---|---|
| 10/13/2025 | Listing removed | $330,000$271/sqft |
Source:  Stellar MLS #TB8334525 Report a problem | ||
| 6/25/2025 | Price change | $330,000-9.6%$271/sqft |
Source: Stellar MLS #TB8334525 Report a problem | ||
| 5/31/2025 | Listed for sale | $365,000$300/sqft |
Source: Stellar MLS #TB8334525 Report a problem | ||
| 5/24/2025 | Pending sale | $365,000$300/sqft |
Source: Stellar MLS #TB8334525 Report a problem | ||
| 4/8/2025 | Price change | $365,000-3.9%$300/sqft |
Source: Stellar MLS #TB8334525 Report a problem | ||
| 3/19/2025 | Pending sale | $380,000$313/sqft |
Source: Stellar MLS #TB8334525 Report a problem | ||
| 1/9/2025 | Listed for sale | $380,000+26.7%$313/sqft |
Source: Stellar MLS #TB8334525 Report a problem | ||
| 10/25/2022 | Sold | $300,000+3.4%$247/sqft |
Source: Public Record Report a problem | ||
| 9/25/2022 | Pending sale | $290,000$238/sqft |
Source: Stellar MLS #T3400510 Report a problem | ||
| 9/21/2022 | Price change | $290,000-3.3%$238/sqft |
Source: Stellar MLS #T3400510 Report a problem | ||
| 9/16/2022 | Price change | $300,000-3.2%$247/sqft |
Source: Stellar MLS #T3400510 Report a problem | ||
| 9/8/2022 | Listed for sale | $310,000-6.1%$255/sqft |
Source: Stellar MLS #T3400510 Report a problem | ||
| 8/15/2022 | Listing removed | -- |
Source: Stellar MLS #T3392138 Report a problem | ||
| 8/4/2022 | Price change | $330,000-5.7%$271/sqft |
Source: Stellar MLS #T3392138 Report a problem | ||
| 7/30/2022 | Listed for sale | $350,000+102.3%$288/sqft |
Source: Stellar MLS #T3392138 Report a problem | ||
| 10/23/2019 | Sold | $173,000-1.1%$142/sqft |
Source: Stellar MLS #T3198339 Report a problem | ||
| 10/3/2019 | Pending sale | $175,000$144/sqft |
Source: FUTURE HOME REALTY INC #T3198339 Report a problem | ||
| 9/12/2019 | Listed for sale | $175,000+124.4%$144/sqft |
Source: FUTURE HOME REALTY INC #T3198339 Report a problem | ||
| 10/5/2018 | Listing removed | $78,000$64/sqft |
Source: MOMENTUM REAL ESTATE #T3118269 Report a problem | ||
| 9/14/2018 | Price change | $78,000-1.3%$64/sqft |
Source: MOMENTUM REAL ESTATE #T3118269 Report a problem | ||
| 8/14/2018 | Price change | $79,000-7.1%$65/sqft |
Source: MOMENTUM REAL ESTATE #T3118269 Report a problem | ||
| 7/25/2018 | Listed for sale | $85,000+129.7%$70/sqft |
Source: MOMENTUM REAL ESTATE #T3118269 Report a problem | ||
| 9/3/2014 | Listing removed | $950$1/sqft |
Source: Fee Free Rental Agency Report a problem | ||
| 8/19/2014 | Price change | $950+2.7%$1/sqft |
Source: Fee Free Rental Agency Report a problem | ||
| 8/9/2014 | Price change | $925-2.6%$1/sqft |
Source: JD & Associates Asset Management Report a problem | ||
| 7/15/2014 | Listed for rent | $950$1/sqft |
Source: JD & Associates Asset Management Report a problem | ||
| 6/24/2014 | Sold | $37,000+91.7%$30/sqft |
Source: Public Record Report a problem | ||
| 4/9/2014 | Sold | $19,300-82.6%$16/sqft |
Source: Public Record Report a problem | ||
| 5/5/2005 | Sold | $110,900+92.9%$91/sqft |
Source: Public Record Report a problem | ||
| 9/29/1999 | Sold | $57,500$47/sqft |
Source: Public Record Report a problem | ||
Public tax history
| Year | Property taxes | Tax assessment |
|---|---|---|
| 2025 | $3,967 +8.9% | $228,559 +2.9% |
| 2024 | $3,644 +4.1% | $222,118 +3% |
| 2023 | $3,501 +60.7% | $215,649 +49.9% |
| 2022 | $2,178 +1.5% | $143,873 +3% |
| 2021 | $2,147 +4% | $139,683 +1.4% |
| 2020 | $2,064 +42.7% | $137,754 +114.6% |
| 2019 | $1,446 | $64,186 -5.1% |
| 2018 | $1,446 +1.7% | $67,622 +25.8% |
| 2017 | $1,421 +11.7% | $53,765 +37.8% |
| 2016 | $1,273 +24.3% | $39,027 +10% |
| 2015 | $1,024 +247.1% | $35,479 -6.3% |
| 2014 | $295 | $37,849 +36.8% |
| 2013 | $295 +2.6% | $27,661 +1.7% |
| 2012 | $288 -45% | $27,199 -29.9% |
| 2011 | $523 -20.3% | $38,800 -14.8% |
| 2010 | $656 -27.1% | $45,528 -35.7% |
| 2009 | $900 -29.8% | $70,784 -23.6% |
| 2008 | $1,283 -15.9% | $92,650 +2.1% |
| 2007 | $1,527 -3.6% | $90,751 +2.5% |
| 2006 | $1,584 +4.3% | $88,538 +51.2% |
| 2005 | $1,518 | $58,555 +57.3% |
| 2004 | -- | $37,226 -3.4% |
| 2003 | -- | $38,534 -4% |
| 2002 | -- | $40,144 +59.7% |
| 2001 | -- | $25,145 -20.1% |
| 2000 | $174 | $31,464 |
Find assessor info on the county website
Monthly payment
Climate risks
Neighborhood: 33619


Similar homes
- $282,0002 bd1 ba1.2k sqft3501 ACORN STREET, TAMPA, FL 33619For Sale

 MLS ID #L4965127, Eli Reeves, FLORIDA REALTY INVESTMENT FIRM. Stellar MLS
- $330,0004 bd1 ba1.3k sqft7507 CORAL VINE LANE, TAMPA, FL 33619For Sale
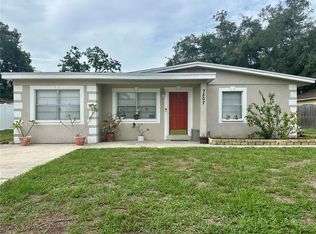 MLS ID #TB8531239, Tanya Wilson, SIGNATURE REALTY ASSOCIATES. Stellar MLS
- $279,9003 bd2 ba1k sqft7109 LIMESTONE LANE, TAMPA, FL 33619For Sale
 MLS ID #TB8550297, Justin Garrett, SKYWAY REAL ESTATE, LLC. Stellar MLS
- $255,7003 bd1 ba904 sqft3602 N 55TH STREET, TAMPA, FL 33619For Sale
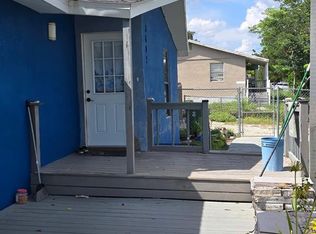 MLS ID #TB8519433, Luamy Mazar Portuondo, AVENUE HOMES LLC. Stellar MLS
- $315,0003 bd2 ba1.3k sqft1825 HEATHER AVE, TAMPA, FL 33612For SaleMLS ID #TB8557397, Meghan Hobson, ORCHARD BROKERAGE, LLC. Stellar MLS
- $300,0003 bd2 ba1.2k sqft2217 MALLORY AVENUE, TAMPA, FL 33605For SaleMLS ID #O6442748, Steven Koleno, BEYCOME OF FLORIDA LLC. Stellar MLS
- $300,0003 bd2 ba1.2k sqft3708 E IDLEWILD AVENUE, TAMPA, FL 33610For SaleMLS ID #TB8523418, Sarah Ferguson, AGILE GROUP REALTY. Stellar MLS
- $265,0003 bd1 ba1.2k sqft4833 ASHLAND DRIVE, TAMPA, FL 33610For SaleMLS ID #L4962564, Helen Weaver, GRACE OF GOD REALTY LLC. Stellar MLS
- $310,0002 bd1 ba1k sqft1738 W COMANCHE AVENUE, TAMPA, FL 33603For SaleMLS ID #TB8555960, Joselin Torres, AVENUE HOMES LLC. Stellar MLS
- $299,9003 bd2 ba1.1k sqft10611 N ALTMAN STREET, TAMPA, FL 33612For SaleMLS ID #TB8510033, Johanna Yanez Hernandez, HOME PRIME REALTY LLC. Stellar MLS
- $305,2213 bd2 ba1.1k sqft8212 N 14TH STREET, TAMPA, FL 33604For SaleMLS ID #TB8545216, Irvin Beacham, Jr., BEACHAM REALTY GROUP LLC. Stellar MLS
- $280,0004 bd2 ba1.7k sqft3504 E 24TH AVENUE, TAMPA, FL 33605For SaleMLS ID #TB8481076, Marcus Scott, SCOTT & FAULK INTERVEST REALTY. Stellar MLS
- $355,0003 bd2 ba1.1k sqft9122 SUFFIELD COURT, TAMPA, FL 33615For SaleMLS ID #TB8566161, Leidy Gonzalez Reyes, MIRANDA LANDA REALTY GROUP LLC. Stellar MLS
- $325,0003 bd1 ba1k sqft916 E 123RD AVENUE, TAMPA, FL 33612For SaleMLS ID #TB8543653, Beth Burnette, PEOPLE'S TRUST REALTY. Stellar MLS
- $320,0004 bd1 ba1.2k sqft(Undisclosed Address), TAMPA, FL 33604For SaleMLS ID #TB8433847, Christine Turner, EXP REALTY LLC. Stellar MLS
- $400,0004 bd3 ba1.7k sqft6819 32ND AVENUE S, TAMPA, FL 33619For SaleMLS ID #TB8537314, George Sanchez, VITA LUXURY REALTY LLC. Stellar MLS
- $275,0004 bd2 ba1.3k sqft2305 E 28TH AVENUE, TAMPA, FL 33605For SaleMLS ID #TB8545791, Andrei Dovgopolyi, FUTURE HOME REALTY INC. Stellar MLS
- $275,0003 bd2 ba976 sqft2933 W WALNUT STREET, TAMPA, FL 33607For SaleMLS ID #TB8562777, Alex Castaneda, 5 STAR WAY REALTY LLC. Stellar MLS
- $300,0003 bd2 ba1.2k sqft6820 LARMON STREET, TAMPA, FL 33634For SaleMLS ID #TB8559008, Giselle Danger Mayo, EXP REALTY LLC. Stellar MLS
- $315,0003 bd2 ba1.5k sqft1703 N TAYLOR ROAD, BRANDON, FL 33510For SaleMLS ID #TB8381844, Dylan Hamilton, WEICHERT REALTORS-BRANDON REALTY. Stellar MLS
