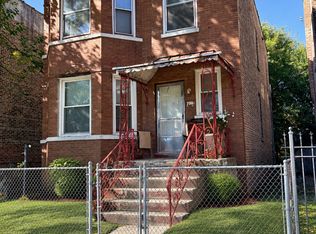
Value-add brick 2-unit with immediate possession! Excellent opportunity for an investor, rehabber, or owner-occupant ready to bring their vision to life. Originally configured as two 2-bedroom, 1-bath units, this property offers tremendous potential. The first floor has been gutted and is ready for renovation, while the second floor is vacant, allowing a new owner to begin improvements right away. Solid brick construction with the opportunity to renovate, add value, and customize both units. Property is being sold AS-IS. Bring your ideas and unlock the potential of this Chicago 2-flat!
Pending
Price cut: $50K (10/1)
$250,000
726 N Troy St, Chicago, IL 60612
2beds
--sqft
Multi Family
Built in 1908
-- sqft lot
$-- Zestimate®
$--/sqft
$-- HOA
What's special
Solid brick construction
- 41 days
- 538
- 52
Zillow last checked:
Listing updated:
Listed by:
Araceli Montalvo (773)406-1900,
Extreme Realty LLC
Source: MRED as distributed by MLS GRID,MLS#: 12754991
Facts & features
Interior
Bedrooms & bathrooms
- Bedrooms: 2
- Bathrooms: 1
- Full bathrooms: 1
Heating
- Natural Gas
Features
- Basement: Unfinished,Full
Property
Parking
- Total spaces: 2
- Parking features: Yes
Lot
- Size: 3,906 Square Feet
- Dimensions: 31x126
Details
- Parcel number: 16121000260000
- Special conditions: None
Construction
Type & style
- Home type: MultiFamily
- Property subtype: Multi Family
Materials
- Brick
Condition
- New construction: No
- Year built: 1908
Utilities & green energy
- Sewer: Public Sewer
- Water: Lake Michigan, Public
Community & HOA
Location
- Region: Chicago
Financial & listing details
- Tax assessed value: $260,000
- Annual tax amount: $4,166
- Date on market: 9/15/2026
- Ownership: Fee Simple
Estimated market value
Not available
Estimated sales range
Not available
$1,799/mo
Price history
| Date | Event | Price |
|---|---|---|
| 10/9/2026 | Pending sale | $250,000 |
Source:  MRED as distributed by MLS GRID #12754991 Report a problem | ||
| 10/1/2026 | Price change | $250,000-16.7% |
Source: MRED as distributed by MLS GRID #12754991 Report a problem | ||
| 9/16/2026 | Listed for sale | $300,000-14.3% |
Source: MRED as distributed by MLS GRID #12754991 Report a problem | ||
| 9/1/2026 | Listing removed | $350,000 |
Source: MRED as distributed by MLS GRID #12565928 Report a problem | ||
| 8/20/2026 | Price change | $350,000-5.4% |
Source: MRED as distributed by MLS GRID #12565928 Report a problem | ||
| 8/3/2026 | Price change | $370,000-2.6% |
Source: MRED as distributed by MLS GRID #12565928 Report a problem | ||
| 6/8/2026 | Price change | $380,000-2.6% |
Source: MRED as distributed by MLS GRID #12565928 Report a problem | ||
| 2/14/2026 | Listed for sale | $390,000+724.1% |
Source: MRED as distributed by MLS GRID #12565928 Report a problem | ||
| 8/23/2014 | Sold | $47,324+18.3% |
Source: MRED as distributed by MLS GRID #08681889 Report a problem | ||
| 7/25/2014 | Listed for sale | $40,000 |
Source: REALHome Services and Solutions #08681889 Report a problem | ||
| 7/22/2014 | Pending sale | $40,000 |
Source: REALHome Services and Solutions #08681889 Report a problem | ||
| 7/22/2014 | Listed for sale | $40,000-88.4% |
Source: REALHome Services and Solutions #08681889 Report a problem | ||
| 7/27/2006 | Sold | $345,000+331.3% |
Source: Public Record Report a problem | ||
| 11/17/2000 | Sold | $80,000 |
Source: Public Record Report a problem | ||
Public tax history
| Year | Property taxes | Tax assessment |
|---|---|---|
| 2024 | $4,575 +9.8% | $26,000 +13% |
| 2023 | $4,166 +3.4% | $22,999 |
| 2022 | $4,027 +1.8% | $22,999 |
| 2021 | $3,955 +59.6% | $22,999 +61.7% |
| 2020 | $2,478 -4.6% | $14,226 -13% |
| 2019 | $2,596 -19.6% | $16,352 |
| 2018 | $3,230 -25.9% | $16,352 -19.2% |
| 2017 | $4,357 +7.5% | $20,240 |
| 2016 | $4,054 +9.3% | $20,240 |
| 2015 | $3,709 +12.5% | $20,240 +13.9% |
| 2014 | $3,297 +2% | $17,769 |
| 2013 | $3,232 +1.4% | $17,769 |
| 2012 | $3,189 -11% | $17,769 -19.6% |
| 2011 | $3,581 -0.4% | $22,099 |
| 2010 | $3,596 +4.4% | $22,099 |
| 2009 | $3,446 -3% | $22,099 -10.8% |
| 2008 | $3,554 +1% | $24,775 |
| 2007 | $3,519 -1.1% | $24,775 |
| 2006 | $3,557 +152.8% | $24,775 +132.7% |
| 2005 | $1,407 +1.9% | $10,649 |
| 2004 | $1,381 +4.5% | $10,649 -22.4% |
| 2003 | $1,322 -5.4% | $13,731 +43% |
| 2002 | $1,397 -16% | $9,600 |
| 2001 | $1,662 +80.3% | $9,600 |
| 2000 | $922 | $9,600 +41.2% |
| 1999 | $922 | $6,798 |
Find assessor info on the county website
Monthly payment
Est. payment
Payment breakdown
Explore the cost of this home by adjusting the details. Changes won't be saved.Climate risks
Neighborhood: East Garfield Park
Nearby schools

Similar homes
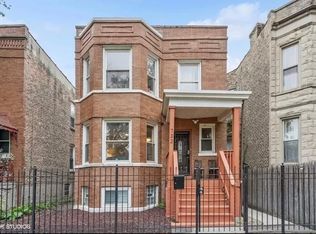
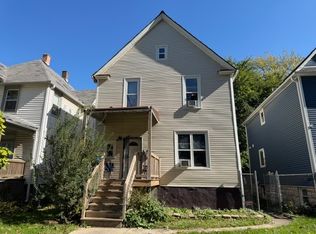
- $279,9005 bd2 ba-- sqft329 N Long Ave, Chicago, IL 60644New
 MLS ID #12791482, Nube Lema, Realty of America. MRED as distributed by MLS GRID
- $249,5003 bd2 ba1.4k sqft2427 S Christiana Ave, Chicago, IL 60623Active
 MLS ID #12789376, Rafay Qamar, Real Broker LLC. MRED as distributed by MLS GRID
- $279,9004 bd2 ba-- sqft1621 N Meade Ave, Chicago, IL 60639Active
 MLS ID #12788940, George Flannick, George Flannick. MRED as distributed by MLS GRID
- $260,0002 bd1 ba850 sqft4011 N Leamington Ave APT 1, Chicago, IL 60641Active
 MLS ID #12790113, Juan Cano, Metropolitan Realty & Development Corp. MRED as distributed by MLS GRID
