$300,000
4 bd|3 ba|2.5k sqft
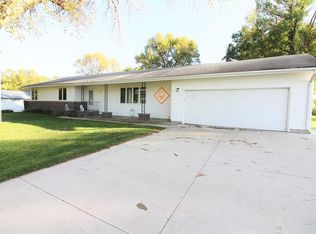
400 Summit Ave, Farnhamville, IA 50538
Sold
Zillow last checked:
Listing updated:
OUTSIDE AGENT 555-555-5555,
OTHER
$211,900
$193,000 - $231,000
$1,233/mo
| Date | Event | Price |
|---|---|---|
| 3/8/2021 | Pending sale | $105,000+2.9%$65/sqft |
Source: | ||
| 3/30/2020 | Listing removed | $102,000$63/sqft |
Source: Owner Report a problem | ||
| 12/31/2019 | Pending sale | $102,000$63/sqft |
Source: Owner Report a problem | ||
| 12/11/2019 | Price change | $102,000-7.2%$63/sqft |
Source: Owner Report a problem | ||
| 11/20/2019 | Price change | $109,900-4.4%$68/sqft |
Source: Owner Report a problem | ||
| 11/16/2019 | Listed for sale | $114,900+9.4%$71/sqft |
Source: Owner Report a problem | ||
| 10/21/2018 | Listing removed | $105,000$65/sqft |
Source: Neighborhood Realty #18157 Report a problem | ||
| 10/9/2018 | Listed for sale | $105,000$65/sqft |
Source: Neighborhood Realty #18157 Report a problem | ||
| 10/9/2018 | Pending sale | $105,000$65/sqft |
Source: Neighborhood Realty #18157 Report a problem | ||
| 9/24/2018 | Price change | $105,000-10.9%$65/sqft |
Source: Neighborhood Realty #18157 Report a problem | ||
| 8/2/2018 | Price change | $117,900-8.6%$73/sqft |
Source: Neighborhood Realty #18157 Report a problem | ||
| 7/6/2018 | Price change | $129,000-7.2%$79/sqft |
Source: Neighborhood Realty #18157 Report a problem | ||
| 5/15/2018 | Listed for sale | $139,000+48.7%$86/sqft |
Source: Neighborhood Realty #18157 Report a problem | ||
| 3/26/2012 | Sold | $93,500$58/sqft |
Source: Public Record Report a problem | ||
| Year | Property taxes | Tax assessment |
|---|---|---|
| 2025 | $1,644 +4.3% | $195,640 +43.9% |
| 2024 | $1,576 +10.2% | $136,000 |
| 2023 | $1,430 -0.1% | $136,000 +29.6% |
| 2022 | $1,432 +9.8% | $104,950 |
| 2021 | $1,304 -1.4% | $104,950 +15.1% |
| 2020 | $1,322 +29.1% | $91,190 |
| 2019 | $1,024 -1.2% | $91,190 +31.9% |
| 2018 | $1,036 -4.3% | $69,140 -5.9% |
| 2016 | $1,082 | $73,450 +6.9% |
| 2015 | $1,082 -13.4% | $68,730 |
| 2014 | $1,250 +39.5% | $68,730 |
| 2013 | $896 +13.4% | -- |
| 2012 | $790 -14.9% | -- |
| 2011 | $928 -3.7% | -- |
| 2010 | $964 +12.9% | -- |
| 2009 | $854 +12.7% | -- |
| 2008 | $758 -2.1% | -- |
| 2007 | $774 | -- |
Find assessor info on the county website
Source: DMMLS. This data may not be complete. We recommend contacting the local school district to confirm school assignments for this home.
A local agent can set up tours, give advice and negotiate with sellers.