This 1678 square foot multi family home has 3 bedrooms and 2.0 bathrooms. This home is located at 7733 S Sangamon St, Chicago, IL 60620.
Foreclosed
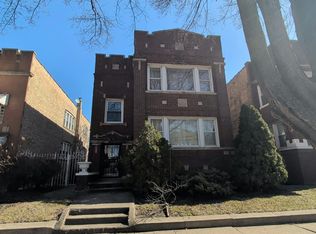
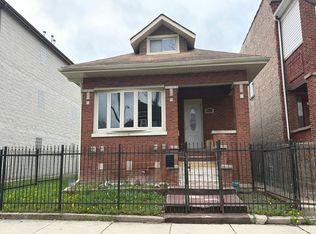
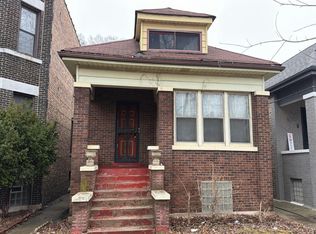
Street View
Est. $150,400
7733 S Sangamon St, Chicago, IL 60620
3beds
2baths
1,678sqft
MultiFamily
Built in 1906
-- sqft lot
$150,400 Zestimate®
$90/sqft
$-- HOA
Overview
- 188 days |
- 8 |
- 0 |
Facts & features
Interior
Bedrooms & bathrooms
- Bedrooms: 3
- Bathrooms: 2
Heating
- Forced air
Cooling
- None
Features
- Basement: Unfinished
Interior area
- Total interior livable area: 1,678 sqft
Property
Parking
- Parking features: Garage - Attached
Lot
- Size: 5,000 Square Feet
Details
- Parcel number: 2029421009
Construction
Type & style
- Home type: MultiFamily
Materials
- Frame
- Foundation: Slab
- Roof: Shake / Shingle
Condition
- Year built: 1906
Community & HOA
Location
- Region: Chicago
Financial & listing details
- Price per square foot: $90/sqft
- Tax assessed value: $120,000
Visit our professional directory to find a foreclosure specialist in your area that can help with your home search.
Find a foreclosure agentForeclosure details
Estimated market value
$150,400
$105,000 - $203,000
$1,860/mo
Price history
Price history is unavailable.
Public tax history
| Year | Property taxes | Tax assessment |
|---|---|---|
| 2024 | -- | $12,000 +20% |
| 2023 | $2,110 +2.6% | $10,000 |
| 2022 | $2,057 +2.3% | $10,000 |
| 2021 | $2,011 -14% | $10,000 -4.7% |
| 2020 | $2,337 -2.4% | $10,492 -12% |
| 2019 | $2,395 +1.7% | $11,923 |
| 2018 | $2,355 -15.2% | $11,923 -7.6% |
| 2017 | $2,776 +7.5% | $12,897 |
| 2016 | $2,583 +9.3% | $12,897 |
| 2015 | $2,363 +79% | $12,897 +9.4% |
| 2014 | $1,320 -0.4% | $11,792 |
| 2013 | $1,325 -1.8% | $11,792 |
| 2012 | $1,349 -12.6% | $11,792 -18.3% |
| 2011 | $1,544 -34.2% | $14,426 |
| 2010 | $2,347 +106.1% | $14,426 |
| 2009 | $1,139 -26.2% | $14,426 -23.4% |
| 2008 | $1,544 +46.3% | $18,823 |
| 2007 | $1,056 +2% | $18,823 |
| 2006 | $1,035 -6.5% | $18,823 +47.9% |
| 2005 | $1,108 +3.1% | $12,729 |
| 2004 | $1,075 +2.5% | $12,729 |
| 2003 | $1,048 -4.4% | $12,729 +42.4% |
| 2002 | $1,096 -8.4% | $8,938 |
| 2001 | $1,197 +6.6% | $8,938 |
| 2000 | $1,123 +0.4% | $8,938 +13.9% |
| 1999 | $1,118 | $7,847 |
Find assessor info on the county website
Monthly payment
Estimated monthly payment$1,822
All calculations are estimates and provided by Zillow, Inc. for informational purposes only. Actual amounts may vary.
HOA fees may include property taxes on listings classified as Co-Ops. Contact the listing agent and/or owner for fee details.
Mortgage interest rates are dependent on a number of factors, including credit score, down payment, and repayment length. Interest rate data provided by Zillow Group Marketplace, Inc. as of 1/1/1970 from various mortgage lenders with which we have lead or other similar arrangements; the Estimated Payment is an average of those rates.
See how much you could borrow to make a competitive offer.
Climate risks
Neighborhood: Gresham
Nearby schools
GreatSchools rating
- 4/10Oglesby Elementary SchoolGrades: PK-8Distance: 0.1 mi
- 1/10Hirsch Metropolitan High SchoolGrades: 9-12Distance: 2.3 mi


- Illinois
- Cook County
- Chicago
- 60620
- Gresham
- 7733 S Sangamon St
Nearby cities
Nearby neighborhoods
Nearby zip codes
Other Chicago Topics
