This inviting 3-bedroom, 2-bath home located in a quiet and peaceful neighborhood of Sunland. Offering a comfortable living environment with a convenient location, this home is ideal for those seeking both tranquility and accessibility. Nearby shopping, dining, and public transportation, making everyday errands and commuting a breeze. Don’t miss the opportunity to make this wonderful Sunland home your own!
For sale
Listed by: Glen West Realty • Nicholas Hacopian • nick@glenwest.com
$925,000
8001 Ellenbogen St, Sunland, CA 91040
3beds
1,529sqft
Single Family Residence
Built in 1955
6,394 Square Feet Lot
$931,300 Zestimate®
$605/sqft
$-- HOA
What's special
- 21 days
- 607
- 24
Zillow last checked:
Listing updated:
Listed by:
Nicholas Hacopian DRE #01093883 nick@glenwest.com,
Glen West Realty
Source: CRMLS,MLS#: GD26221340 Originating MLS: California Regional MLS
Facts & features
Interior
Bedrooms & bathrooms
- Bedrooms: 3
- Bathrooms: 2
- Full bathrooms: 2
- Main level bathrooms: 1
- Main level bedrooms: 1
Rooms
- Room types: Den, Family Room, Laundry
Heating
- Central
Cooling
- Central Air
Appliances
- Laundry: Gas Dryer Hookup
Features
- Has fireplace: Yes
- Fireplace features: Family Room, Gas
- Common walls with other units/homes: No Common Walls
Interior area
- Total interior livable area: 1,529 sqft
Property
Parking
- Total spaces: 2
- Parking features: Garage - Attached
- Attached garage spaces: 2
Features
- Levels: One
- Stories: 1
- Entry location: Street Entry
- Pool features: None
Lot
- Size: 6,394 Square Feet
- Features: 0-1 Unit/Acre
Details
- Parcel number: 2551038012
- Special conditions: Standard
Construction
Type & style
- Home type: SingleFamily
- Property subtype: Single Family Residence
Condition
- New construction: No
- Year built: 1955
Utilities & green energy
- Sewer: Septic Tank
- Water: Private
Community & HOA
Community
- Features: Sidewalks
Location
- Region: Sunland
Financial & listing details
- Price per square foot: $605/sqft
- Tax assessed value: $666,803
- Date on market: 10/12/2026
- Cumulative days on market: 22 days
- Listing terms: Cash to Existing Loan
Estimated market value
$931,300
$885,000 - $978,000
$3,999/mo
Price history
| Date | Event | Price |
|---|---|---|
| 10/12/2026 | Listed for sale | $925,000+97.2%$605/sqft |
Source:  CRMLS #GD26221340 Report a problem | ||
| 9/13/2004 | Sold | $469,000$307/sqft |
Source: Public Record Report a problem | ||
Public tax history
| Year | Property taxes | Tax assessment |
|---|---|---|
| 2026 | -- | $666,803 +2% |
| 2025 | $7,971 +1.2% | $653,729 +2% |
| 2024 | $7,873 +2% | $640,912 +2% |
| 2023 | $7,720 +4.9% | $628,346 +2% |
| 2022 | $7,360 +1.3% | $616,026 +2% |
| 2021 | $7,265 -1% | $603,948 +1% |
| 2020 | $7,337 | $597,756 +2% |
| 2019 | $7,337 +5.4% | $586,036 +2% |
| 2018 | $6,963 | $574,546 +2% |
| 2017 | $6,963 +2.3% | $563,281 +7.1% |
| 2016 | $6,808 +7.5% | $526,000 +9.8% |
| 2015 | $6,334 +13.7% | $479,000 +6.2% |
| 2014 | $5,571 | $451,000 +43.2% |
| 2012 | -- | $315,000 -7.2% |
| 2011 | -- | $339,400 |
| 2010 | -- | $339,400 |
| 2009 | -- | $339,400 -31.8% |
| 2008 | -- | $497,704 +2% |
| 2007 | -- | $487,946 +2% |
| 2006 | -- | $478,380 |
| 2005 | -- | $478,380 +67.6% |
| 2004 | -- | $285,431 +1.9% |
| 2003 | -- | $280,201 +14.6% |
| 2002 | -- | $244,600 +14.3% |
| 2000 | -- | $214,000 |
Find assessor info on the county website
Monthly payment
Est. payment
Payment breakdown
Explore the cost of this home by adjusting the details. Changes won't be saved.Climate risks
Neighborhood: Sunland
Similar homes
- $839,0003 bd2 ba1.2k sqft11026 Woodward Ave, Sunland, CA 91040For Sale
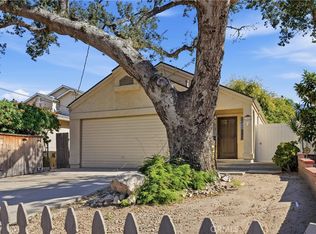 MLS ID #AR26196281, Pamela Cimino, Seven Gables Real Estate. CRMLS
- $949,0003 bd2 ba1.3k sqft7838 Ellenbogen St, Sunland, CA 91040For Sale
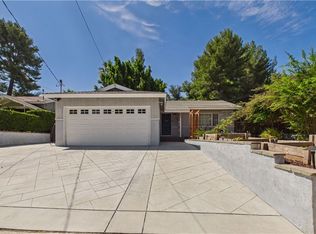 MLS ID #GD26174316, Patricia Ramsey, BERKSHIRE HATHAWAY Crest R.E.. CRMLS
- $968,0004 bd3 ba2k sqft8548 Wyngate St, Sunland, CA 91040For Sale
 MLS ID #26105079, Brooke McCreary DRE # 02103902, Redfin. CLAW
- $949,0002 bd4 ba1.3k sqft7844 Wentworth St, Sunland, CA 91040For Sale
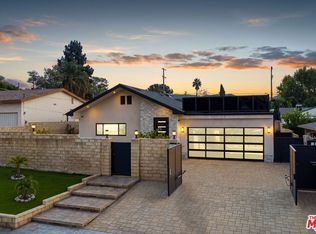 MLS ID #26103221, Eric De Los Santos DRE # 02116150, Compass. CLAW
