Great Home on corner lot featuring 3bed/2bath/2 car garage.... Quartz Tops in the Kitchen, Fresh Paint and carpet, light fixtures and flooring.....Nice Hardwoods in all the bedrooms. A nice inviting fireplace in the living room just in time to snuggle before the holidays....
Active
$190,000
8604 E 84th Ter, Raytown, MO 64138
3beds
1,258sqft
Single Family Residence
Built in 1960
10,454 Square Feet Lot
$-- Zestimate®
$151/sqft
$-- HOA
What's special
Fresh paintCorner lot
- 24 days
- 822
- 111
Likely to sell faster than
Zillow last checked:
Listing updated:
Listed by:
Fidelity RE Group 816-772-2876,
Keller Williams KC North,
Jeff Taylor 816-261-8699,
Keller Williams KC North
Source: Heartland MLS as distributed by MLS GRID,MLS#: 2648001
Facts & features
Interior
Bedrooms & bathrooms
- Bedrooms: 3
- Bathrooms: 2
- Full bathrooms: 2
Dining room
- Description: Formal
Heating
- Forced Air
Cooling
- Central Gas
Appliances
- Included: Cooktop, Dishwasher, Built-In Oven
- Laundry: In Basement
Features
- Painted Cabinets
- Flooring: Carpet, Vinyl, Wood
- Basement: Unfinished,Walk-Up Access
- Number of fireplaces: 1
- Fireplace features: Living Room, Wood Burning
Interior area
- Total structure area: 1,258
- Total interior livable area: 1,258 sqft
- Finished area above ground: 1,258
- Finished area below ground: 0
Property
Parking
- Total spaces: 2
- Parking features: Attached
- Attached garage spaces: 2
Features
- Patio & porch: Patio, Covered
Lot
- Size: 10,454 Square Feet
- Features: City Lot, Corner Lot
Details
- Parcel number: 50310090900000000
Construction
Type & style
- Home type: SingleFamily
- Architectural style: Traditional
- Property subtype: Single Family Residence
Materials
- Other
- Roof: Composition
Condition
- Year built: 1960
Utilities & green energy
- Sewer: Public Sewer
- Water: Public
Community & HOA
Community
- Subdivision: Westridge
HOA
- Has HOA: No
Location
- Region: Raytown
Financial & listing details
- Price per square foot: $151/sqft
- Tax assessed value: $142,830
- Annual tax amount: $2,674
- Date on market: 10/29/2026
- Listing terms: Cash,Conventional,FHA,VA Loan
- Ownership: Investor
Estimated market value
Not available
Estimated sales range
Not available
Not available
Price history
| Date | Event | Price |
|---|---|---|
| 10/29/2026 | Listed for sale | $190,000$151/sqft |
Source:  Heartland MLS as distributed by MLS GRID #2648001 Report a problem | ||
| 10/13/2026 | Price change | $1,600-11.1%$1/sqft |
Source: Zillow Rentals Report a problem | ||
| 9/28/2026 | Listed for rent | $1,800+12.5%$1/sqft |
Source: Zillow Rentals Report a problem | ||
| 8/19/2026 | Listing removed | $190,000$151/sqft |
Source: Heartland MLS as distributed by MLS GRID #2606557 Report a problem | ||
| 8/10/2026 | Listing removed | $1,600$1/sqft |
Source: Zillow Rentals Report a problem | ||
| 7/28/2026 | Price change | $190,000-5%$151/sqft |
Source: Heartland MLS as distributed by MLS GRID #2606557 Report a problem | ||
| 6/15/2026 | Listed for rent | $1,600$1/sqft |
Source: Zillow Rentals Report a problem | ||
| 6/7/2026 | Listed for sale | $200,000$159/sqft |
Source: Heartland MLS as distributed by MLS GRID #2606557 Report a problem | ||
| 6/4/2026 | Listing removed | $1,600$1/sqft |
Source: Zillow Rentals Report a problem | ||
| 6/2/2026 | Pending sale | $200,000$159/sqft |
Source: Heartland MLS as distributed by MLS GRID #2606557 Report a problem | ||
| 5/12/2026 | Listed for rent | $1,600+14.3%$1/sqft |
Source: Zillow Rentals Report a problem | ||
| 5/8/2026 | Listed for sale | $200,000$159/sqft |
Source: Heartland MLS as distributed by MLS GRID #2606557 Report a problem | ||
| 4/24/2026 | Pending sale | $200,000$159/sqft |
Source: Heartland MLS as distributed by MLS GRID #2606557 Report a problem | ||
| 4/3/2026 | Listed for sale | $200,000+2.6%$159/sqft |
Source: Heartland MLS as distributed by MLS GRID #2606557 Report a problem | ||
| 1/27/2026 | Listing removed | $195,000$155/sqft |
Source: Heartland MLS as distributed by MLS GRID #2582028 Report a problem | ||
| 10/16/2025 | Listed for sale | $195,000+18.2%$155/sqft |
Source: Heartland MLS as distributed by MLS GRID #2582028 Report a problem | ||
| 9/28/2023 | Listing removed | -- |
Source: Zillow Rentals Report a problem | ||
| 9/20/2023 | Listed for rent | $1,400$1/sqft |
Source: Zillow Rentals Report a problem | ||
| 5/1/2023 | Listing removed | -- |
Source: Zillow Rentals Report a problem | ||
| 4/13/2023 | Listed for rent | $1,400+27.3%$1/sqft |
Source: Zillow Rentals Report a problem | ||
| 4/11/2022 | Listing removed | -- |
Source: Zillow Rental Manager Report a problem | ||
| 4/5/2022 | Price change | $1,100-15.4%$1/sqft |
Source: Zillow Rental Manager Report a problem | ||
| 1/14/2022 | Listed for rent | $1,300$1/sqft |
Source: Zillow Rental Manager Report a problem | ||
| 1/14/2022 | Listing removed | -- |
Source:  RE/MAX of Kansas-Missouri Report a problem | ||
| 11/3/2021 | Listed for sale | $165,000$131/sqft |
Source: Heartland MLS as distributed by MLS GRID #2352009 Report a problem | ||
Public tax history
| Year | Property taxes | Tax assessment |
|---|---|---|
| 2025 | $2,464 -7.9% | $27,138 -8.5% |
| 2024 | $2,674 +0.7% | $29,646 |
| 2023 | $2,656 +37.6% | $29,646 +44.5% |
| 2022 | $1,930 -0.3% | $20,521 |
| 2021 | $1,937 -1.3% | $20,521 -0.3% |
| 2020 | $1,962 +0.5% | $20,588 |
| 2019 | $1,952 | $20,588 +8% |
| 2018 | $1,952 +8.6% | $19,069 |
| 2017 | $1,796 +5.9% | $19,069 +2.6% |
| 2016 | $1,696 +2.1% | $18,592 +3% |
| 2014 | $1,662 +0.1% | $18,050 |
| 2013 | $1,660 +0.1% | $18,050 |
| 2012 | $1,659 +2.8% | $18,050 |
| 2011 | $1,613 +1.5% | $18,050 +3.1% |
| 2010 | $1,589 -8.2% | $17,508 |
| 2009 | $1,730 +12.3% | $17,508 -16% |
| 2008 | $1,541 -0.3% | $20,843 |
| 2007 | $1,545 +6.8% | $20,843 |
| 2006 | $1,448 +9.4% | $20,843 |
| 2005 | $1,323 +0% | $20,843 +14% |
| 2004 | $1,323 +10.6% | $18,283 |
| 2003 | $1,196 +0.1% | $18,283 +14% |
| 2002 | $1,195 +16.9% | $16,038 |
| 2001 | $1,022 | $16,038 |
Find assessor info on the county website
Monthly payment
Est. payment
Payment breakdown
Explore the cost of this home by adjusting the details. Changes won't be saved.Climate risks
Neighborhood: 64138


Similar homes
- $195,0004 bd2 ba1.4k sqft8712 E 77th St, Kansas City, MO 64138For Sale
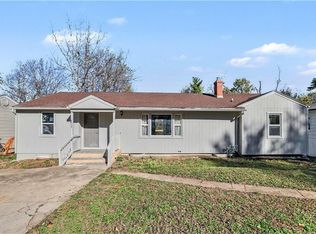 MLS ID #2651087, Laith Alabidi, ReeceNichols - Lees Summit. Heartland MLS as distributed by MLS GRID
- $205,0003 bd2 ba1.5k sqft7904 E 87th St, Raytown, MO 64138For Sale
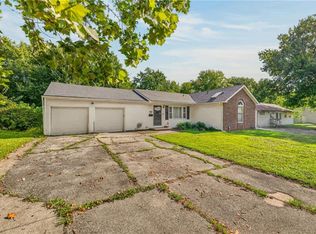 MLS ID #2636505, Mr.D Davidson, Keller Williams Platinum Prtnr. Heartland MLS as distributed by MLS GRID
- $198,0003 bd2 ba1.2k sqft7507 E 85th St, Kansas City, MO 64138For Sale
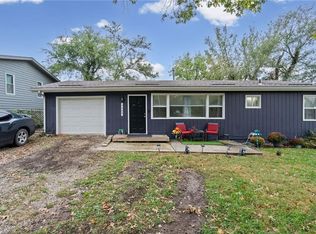 MLS ID #2645498, Shaniece Lewis, EXP Realty LLC. Heartland MLS as distributed by MLS GRID
- $225,0003 bd2 ba1.4k sqft9050 E 84th St, Raytown, MO 64138For Sale
 MLS ID #2636489, Brian Glasser, 1st Class Real Estate KC. Heartland MLS as distributed by MLS GRID
