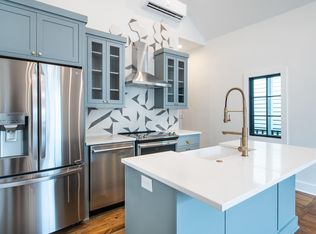
Prime Investment Opportunity in the heart of Downtown Charleston! No HOA! - new pella windows approved by BAR- new interior doors- sheet rock- electric tankless hot water heater- new hvac unit and air condensor-All SS AppliancesIncluded in price.
Active
$419,000
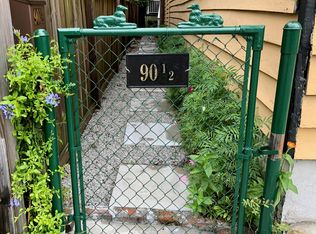
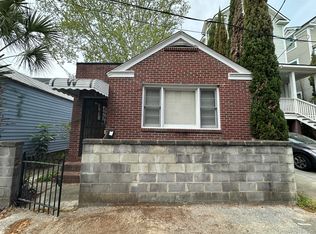
90 Romney St, Charleston, SC 29403
2beds
792sqft
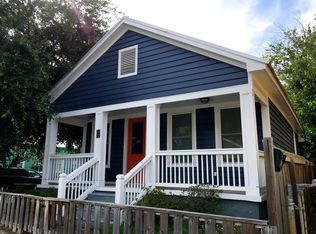
Single Family Residence
Built in 1920
1,306 Square Feet Lot
$401,100 Zestimate®
$529/sqft
$-- HOA
What's special
New interior doorsNew pella windows
- 6 days |
- 364 |
- 7 |
Zillow last checked:
Listing updated:
Listed by:
The Boulevard Company
Source: CTMLS,MLS#: 26017719
Loading...
Facts & features
Interior
Bedrooms & bathrooms
- Bedrooms: 2
- Bathrooms: 1
- Full bathrooms: 1
Cooling
- Central Air
Features
- Has fireplace: No
Interior area
- Total structure area: 792
- Total interior livable area: 792 sqft
Property
Features
- Levels: One
- Stories: 1
- Fencing: Wire
Lot
- Size: 1,306 Square Feet
- Features: 0 - .5 Acre, High
Details
- Parcel number: 4631202064
Construction
Type & style
- Home type: SingleFamily
- Architectural style: Cottage
- Property subtype: Single Family Residence
Materials
- Wood Siding
- Foundation: Crawl Space
Condition
- New construction: No
- Year built: 1920
Utilities & green energy
- Sewer: Public Sewer
- Water: Public
Community & HOA
Community
- Subdivision: North Central
Location
- Region: Charleston
Financial & listing details
- Price per square foot: $529/sqft
- Tax assessed value: $180,053
- Annual tax amount: $428
- Date on market: 6/18/2026
- Listing terms: Cash,Conventional
Estimated market value
$401,100
$381,000 - $421,000
$2,556/mo
Price history
| Date | Event | Price |
|---|---|---|
| 6/18/2026 | Listed for sale | $419,000+10.3%$529/sqft |
Source: | ||
| 3/26/2026 | Listing removed | $379,900$480/sqft |
Source: | ||
| 3/17/2026 | Price change | $379,900-5%$480/sqft |
Source: | ||
| 3/9/2026 | Price change | $399,900-5.9%$505/sqft |
Source: | ||
| 2/28/2026 | Listed for sale | $425,000+41.7%$537/sqft |
Source: | ||
| 11/3/2025 | Sold | $300,000-14.3%$379/sqft |
Source: | ||
| 4/24/2025 | Listed for sale | $350,000$442/sqft |
Source: | ||
| 2/26/2025 | Contingent | $350,000$442/sqft |
Source: | ||
| 2/24/2025 | Listed for sale | $350,000+150%$442/sqft |
Source: | ||
| 2/19/2019 | Listing removed | $1,600$2/sqft |
Source: CCBG Real Estate Group #19004610 Report a problem | ||
| 2/16/2019 | Listed for rent | $1,600$2/sqft |
Source: CCBG Real Estate Group #19004610 Report a problem | ||
| 5/29/2018 | Listing removed | $1,600$2/sqft |
Source: Owner Report a problem | ||
| 4/27/2018 | Listed for rent | $1,600$2/sqft |
Source: Owner Report a problem | ||
| 12/7/2017 | Sold | $140,000$177/sqft |
Source: Public Record Report a problem | ||
| 5/31/2017 | Listing removed | $1,600$2/sqft |
Source: Owner Report a problem | ||
| 4/9/2017 | Listed for rent | $1,600$2/sqft |
Source: Owner Report a problem | ||
| 5/23/2016 | Sold | $140,000+250%$177/sqft |
Source: Public Record Report a problem | ||
| 8/23/2005 | Sold | $40,000$51/sqft |
Source: Public Record Report a problem | ||
| 3/28/2003 | Sold | $40,000$51/sqft |
Source: Public Record Report a problem | ||
Public tax history
| Year | Property taxes | Tax assessment |
|---|---|---|
| 2024 | $428 +2.6% | $2,260 |
| 2023 | $418 +15% | $2,260 |
| 2022 | $363 -3.6% | $2,260 |
| 2021 | $377 -2.8% | $2,260 |
| 2020 | $388 | $2,260 +18.3% |
| 2019 | $388 | $1,910 -20.7% |
| 2017 | $388 -62.5% | $2,410 -33.2% |
| 2016 | $1,035 +3.1% | $3,610 |
| 2015 | $1,004 +4.4% | $3,610 |
| 2014 | $962 | -- |
| 2011 | $962 +10.8% | -- |
| 2010 | $868 -2.8% | $3,360 |
| 2009 | $893 +3.1% | $3,360 |
| 2008 | $867 +11% | $3,360 |
| 2006 | $781 -0.5% | $3,360 |
| 2005 | $785 +52.9% | $3,360 +100% |
| 2004 | $513 +0.8% | $1,680 |
| 2003 | $509 +2.3% | $1,680 |
| 2002 | $498 -3.7% | $1,680 +12% |
| 2000 | $517 | $1,500 |
Find assessor info on the county website
Monthly payment
Est. payment$--/mo
Payment breakdown
Explore the cost of this home by adjusting the details. Changes won't be saved.All calculations are estimates and provided by Zillow, Inc. for informational purposes only. Actual amounts may vary.
HOA fees may include property taxes on listings classified as Co-Ops. Contact the listing agent and/or owner for fee details.
Mortgage interest rates are dependent on a number of factors, including credit score, down payment, and repayment length. Interest rate data provided by Zillow Group Marketplace, Inc. as of 1/1/1970 from various mortgage lenders with which we have lead or other similar arrangements; the Estimated Payment is an average of those rates.
See how much you could borrow to make a competitive offer.
Climate risks
Neighborhood: East Central
Nearby schools
GreatSchools rating
- 7/10Sanders-Clyde Elementary SchoolGrades: PK-5Distance: 0.7 mi
- 4/10Simmons Pinckney Middle SchoolGrades: 6-8Distance: 1 mi
- 1/10Burke High SchoolGrades: 9-12Distance: 1 mi
Schools provided by the listing agent
- Elementary: Sanders Clyde
- Middle: Simmons Pinckney
- High: Burke
Source: CTMLS. This data may not be complete. We recommend contacting the local school district to confirm school assignments for this home.
A local agent can set up tours, give advice and negotiate with sellers.


Nearby cities
Nearby neighborhoods
Nearby zip codes
Other Charleston Topics
