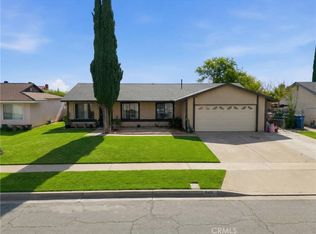
Single-story Fontana home featuring 3 bedrooms, 2 bathrooms, and approximately 1,441 square feet of living space on a spacious 9,010-square-foot lot. Mature palm trees, a green front lawn, and brick accents create inviting curb appeal, while the wide driveway and attached two-car garage provide convenient parking. The home includes leased solar panels with a monthly lease payment of $135. The generous lot provides room to enjoy outdoor living.
For sale
Listed by: RE/MAX TIME REALTY • LETICIA ARTEAGA • 951-776-6014
$597,000
9067 Williams Ct, Fontana, CA 92335
3beds
1,441sqft
Single Family Residence
Built in 1981
9,010 Square Feet Lot
$602,100 Zestimate®
$414/sqft
$-- HOA
What's special
- 6 days
- 134
- 12
Likely to sell faster than
Zillow last checked:
Listing updated:
Listed by:
LETICIA ARTEAGA DRE #01171884 951-776-6014,
RE/MAX TIME REALTY
Source: CRMLS,MLS#: IV26243775 Originating MLS: California Regional MLS
Facts & features
Interior
Bedrooms & bathrooms
- Bedrooms: 3
- Bathrooms: 2
- Full bathrooms: 2
- Main level bathrooms: 2
- Main level bedrooms: 3
Rooms
- Room types: Bedroom
Bedroom
- Features: All Bedrooms Down
Heating
- Central
Cooling
- Central Air
Appliances
- Laundry: In Garage
Features
- All Bedrooms Down
- Has fireplace: No
- Fireplace features: None
- Common walls with other units/homes: No Common Walls
Interior area
- Total interior livable area: 1,441 sqft
Property
Parking
- Total spaces: 2
- Parking features: Garage - Attached
- Attached garage spaces: 2
Features
- Levels: One
- Stories: 1
- Entry location: 1
- Pool features: None
- Has view: Yes
- View description: Neighborhood
Lot
- Size: 9,010 Square Feet
- Features: 0-1 Unit/Acre
Details
- Parcel number: 0249051440000
- Special conditions: Short Sale
Construction
Type & style
- Home type: SingleFamily
- Property subtype: Single Family Residence
Condition
- New construction: No
- Year built: 1981
Utilities & green energy
- Sewer: Public Sewer
- Water: Public
Community & HOA
Community
- Features: Street Lights
Location
- Region: Fontana
Financial & listing details
- Price per square foot: $414/sqft
- Tax assessed value: $627,300
- Date on market: 11/13/2026
- Cumulative days on market: 7 days
- Listing terms: Cash,Cash to New Loan,Conventional,FHA,VA Loan
Estimated market value
$602,100
$572,000 - $632,000
Not available
Price history
| Date | Event | Price |
|---|---|---|
| 11/15/2026 | Listed for sale | $597,000-2.9%$414/sqft |
Source:  CRMLS #IV26243775 Report a problem | ||
| 10/24/2024 | Sold | $615,000+4.2%$427/sqft |
Source: CRMLS #CV24195509 Report a problem | ||
| 10/15/2024 | Pending sale | $590,000$409/sqft |
Source: CRMLS #CV24195509 Report a problem | ||
| 10/5/2024 | Contingent | $590,000$409/sqft |
Source: CRMLS #CV24195509 Report a problem | ||
| 9/20/2024 | Listed for sale | $590,000+14.9%$409/sqft |
Source: CRMLS #CV24195509 Report a problem | ||
| 7/28/2021 | Sold | $513,500+0.7%$356/sqft |
Source: Public Record Report a problem | ||
| 6/30/2021 | Pending sale | $510,000+36%$354/sqft |
Source: CRMLS #IV21124126 Report a problem | ||
| 5/8/2019 | Sold | $375,000-1.1%$260/sqft |
Source: Public Record Report a problem | ||
| 3/23/2019 | Pending sale | $379,000$263/sqft |
Source: Michael R. Brown #SR19021452 Report a problem | ||
| 2/25/2019 | Listed for sale | $379,000+146.1%$263/sqft |
Source: Michael R. Brown #SR19021452 Report a problem | ||
| 4/29/2009 | Sold | $154,000+0.7%$107/sqft |
Source: Public Record Report a problem | ||
| 2/3/2009 | Price change | $152,900-7.3%$106/sqft |
Source: Listhub #S558981 Report a problem | ||
| 1/10/2009 | Listed for sale | $164,900+19.1%$114/sqft |
Source: Listhub #S558981 Report a problem | ||
| 12/11/2008 | Sold | $138,512-66.4%$96/sqft |
Source: Public Record Report a problem | ||
| 11/28/2006 | Sold | $412,000+35.1%$286/sqft |
Source: Public Record Report a problem | ||
| 11/5/2004 | Sold | $305,000$212/sqft |
Source: Public Record Report a problem | ||
Public tax history
| Year | Property taxes | Tax assessment |
|---|---|---|
| 2026 | -- | $627,300 +2% |
| 2025 | $7,709 +18.2% | $615,000 +15.1% |
| 2024 | $6,524 +10.4% | $534,247 +2% |
| 2023 | $5,912 +0.7% | $523,771 +2% |
| 2022 | $5,872 +29.3% | $513,500 +32.9% |
| 2021 | $4,540 +0.5% | $386,463 +1% |
| 2020 | $4,515 +98.1% | $382,500 +115.2% |
| 2019 | $2,279 -13.1% | $177,781 +2% |
| 2018 | $2,622 +2.1% | $174,295 +2% |
| 2017 | $2,570 | $170,877 +2% |
| 2016 | $2,570 +2.3% | $167,527 +1.5% |
| 2015 | $2,512 +2.7% | $165,011 +2% |
| 2014 | $2,446 | $161,778 +0.5% |
| 2013 | -- | $161,046 +2% |
| 2012 | -- | $157,888 +2% |
| 2011 | -- | $154,792 +0.8% |
| 2010 | -- | $153,635 -19.1% |
| 2009 | -- | $190,000 -45.7% |
| 2008 | -- | $350,000 -15% |
| 2007 | -- | $412,000 +32.4% |
| 2006 | -- | $311,100 +2% |
| 2005 | -- | $305,000 +184.6% |
| 2004 | -- | $107,152 +1.9% |
| 2003 | -- | $105,188 +2% |
| 2002 | -- | $103,125 +2% |
| 2001 | -- | $101,103 +2% |
| 2000 | -- | $99,120 |
Find assessor info on the county website
Monthly payment
Est. payment
Payment breakdown
Explore the cost of this home by adjusting the details. Changes won't be saved.Climate risks
Neighborhood: 92335
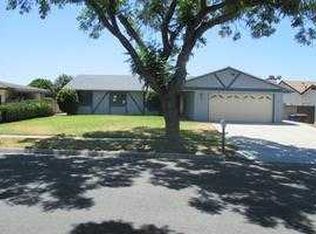
Similar homes
- $644,9003 bd2 ba1.7k sqft9081 Tangelo Ave, Fontana, CA 92335For Sale
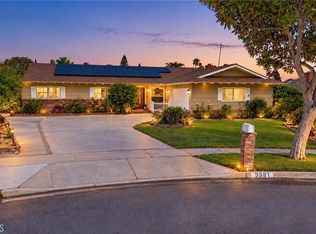 MLS ID #DW26210344, Joseph Murnik, Circa Properties Inc.. CRMLS
- $675,0004 bd2 ba1.6k sqft16108 Tullock St, Fontana, CA 92335For Sale
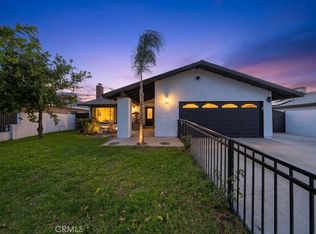 MLS ID #DW26081826, Erika Romo, First Class Real Estate. CRMLS
- $565,0003 bd2 ba1k sqft14517 Elderwood Dr, Fontana, CA 92337For Sale
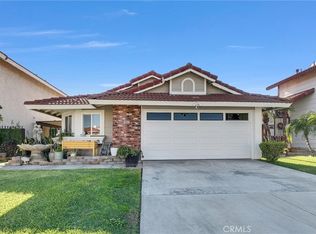 MLS ID #IV26238210, MARIA JUAREZ, RUTH E TORRES REALTY. CRMLS
- $605,0004 bd2 ba1.2k sqft645 W Winchester Ave, Rialto, CA 92376For Sale
 MLS ID #CV26000977, Marvin Rodriguez, MarvNation Realty. CRMLS
