$--
2 bd|1 ba|900 sqft
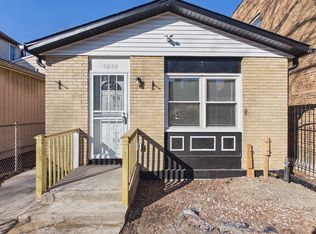
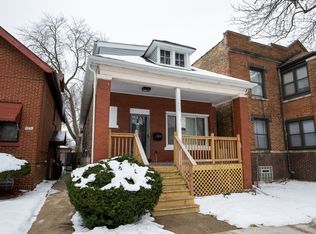
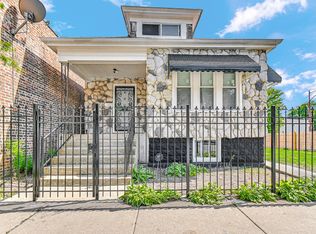
915 E 76th St #1, Chicago, IL 60619
Off Market

Zillow last checked:
Listing updated:
Maricela Wilson 708-510-9597,
Smart Home Realty
$194,600
$185,000 - $204,000
$2,352/mo
| Date | Event | Price |
|---|---|---|
| 5/5/2026 | Listed for sale | $195,000$195/sqft |
Source: | ||
| 5/2/2026 | Contingent | $195,000$195/sqft |
Source: | ||
| 4/17/2026 | Price change | $195,000-2%$195/sqft |
Source: | ||
| 2/24/2026 | Listed for sale | $199,000+25.2%$199/sqft |
Source: | ||
| 1/30/2025 | Listing removed | $159,000$159/sqft |
Source: | ||
| 10/18/2024 | Listed for sale | $159,000-5.9%$159/sqft |
Source: | ||
| 9/12/2024 | Listing removed | $169,000$169/sqft |
Source: | ||
| 11/30/2022 | Listed for sale | $169,000-3.4%$169/sqft |
Source: | ||
| 11/30/2022 | Listing removed | -- |
Source: | ||
| 10/14/2022 | Listed for sale | $175,000$175/sqft |
Source: | ||
| 9/16/2022 | Listing removed | -- |
Source: | ||
| 8/5/2022 | Listed for sale | $175,000+88.2%$175/sqft |
Source: | ||
| 5/6/2021 | Listing removed | -- |
Source: | ||
| 3/12/2021 | Pending sale | $93,000$93/sqft |
Source: | ||
| 12/24/2020 | Listed for sale | $93,000+21.6%$93/sqft |
Source: Keller Williams Preferred Realty #10958245 Report a problem | ||
| 2/3/2020 | Listing removed | $1,500$2/sqft |
Source: Zillow Rental Network Report a problem | ||
| 12/19/2019 | Listed for rent | $1,500$2/sqft |
Source: Zillow Rental Network Report a problem | ||
| 10/19/2005 | Sold | $76,500-12.6%$77/sqft |
Source: Public Record Report a problem | ||
| 2/11/2004 | Sold | $87,500$88/sqft |
Source: Public Record Report a problem | ||
| Year | Property taxes | Tax assessment |
|---|---|---|
| 2024 | -- | $7,001 +9.8% |
| 2023 | $1,345 +2.6% | $6,374 |
| 2022 | $1,311 +2.3% | $6,374 |
| 2021 | $1,282 -50.9% | $6,374 -45.6% |
| 2020 | $2,610 +0.9% | $11,715 -9% |
| 2019 | $2,587 +1.7% | $12,874 |
| 2018 | $2,543 +5.2% | $12,874 +14.6% |
| 2017 | $2,418 +7.5% | $11,234 |
| 2016 | $2,250 +9.3% | $11,234 |
| 2015 | $2,059 +8.2% | $11,234 +9.5% |
| 2014 | $1,903 +2% | $10,256 |
| 2013 | $1,865 -7.7% | $10,256 -8.9% |
| 2012 | $2,020 +0.7% | $11,259 -9% |
| 2011 | $2,005 -0.4% | $12,376 |
| 2010 | $2,014 +4.4% | $12,376 |
| 2009 | $1,930 +6.4% | $12,376 -2.1% |
| 2008 | $1,814 +1% | $12,646 |
| 2007 | $1,796 -1.1% | $12,646 |
| 2006 | $1,815 +16.5% | $12,646 +32.6% |
| 2005 | $1,559 +1% | $9,539 |
| 2004 | $1,543 +2.2% | $9,539 |
| 2003 | $1,509 -5.1% | $9,539 +7.8% |
| 2002 | $1,590 +3.8% | $8,850 |
| 2001 | $1,533 +41.4% | $8,850 |
| 2000 | $1,084 +130.5% | $8,850 +56.9% |
| 1999 | $470 | $5,642 |
Find assessor info on the county website
Source: MRED as distributed by MLS GRID. This data may not be complete. We recommend contacting the local school district to confirm school assignments for this home.
A local agent can set up tours, give advice and negotiate with sellers.