Seller Finance Option
Down Pmt: 10-15%
Interest Rate: 5%
Term: 3-5 years
Full interior remodel in 2021. Solar panels.
2000 sq ft basement apt. w/ walkout basement entrance or make it part of your home and use it all.
Large front room/office/extra bedroom on the main level, bonus room in basement, 3 family rooms, 5 bedrooms, 3 bathrooms, 2 laundry rooms, 2 kitchens, storage room, 2 car garage, & 1 car carport.
Backyard has a playground with rubber, above ground pool, shed, deck, and pavilion.
NEW AC & newer roof in great condition.
Amazing neighborhood!!
For sale by owner
Price cut: $30K (9/23)
$950,000
9507 S 1860 W, South Jordan, UT 84095
5beds
4,400sqft
SingleFamily
Built in 1996
0.33 Acres Lot
$899,700 Zestimate®
$216/sqft
$-- HOA
What's special
Storage roomAbove ground poolNew acSolar panelsBonus room in basement
- 47 days
- 525
- 39
Listed by:
Property Owner (435) 760-2260
Facts & features
Interior
Bedrooms & bathrooms
- Bedrooms: 5
- Bathrooms: 3
- Full bathrooms: 3
Heating
- Forced air, Other, Gas
Cooling
- Central, Solar
Appliances
- Included: Dishwasher, Dryer, Freezer, Garbage disposal, Microwave, Range / Oven, Refrigerator, Washer
Features
- Flooring: Tile, Carpet, Laminate
- Basement: Finished
- Has fireplace: Yes
Interior area
- Total interior livable area: 4,400 sqft
Property
Parking
- Parking features: Carport, Garage - Attached
Features
- Exterior features: Stucco, Brick
Lot
- Size: 0.33 Acres
Details
- Parcel number: 27101270290000
Construction
Type & style
- Home type: SingleFamily
Materials
- Other
- Roof: Shake / Shingle
Condition
- New construction: No
- Year built: 1996
Community & HOA
Location
- Region: South Jordan
Financial & listing details
- Price per square foot: $216/sqft
- Tax assessed value: $867,100
- Annual tax amount: $4,372
- Date on market: 9/8/2026
Estimated market value
$899,700
$855,000 - $945,000
$3,438/mo
Price history
| Date | Event | Price |
|---|---|---|
| 10/17/2026 | Listing removed | $2,600$1/sqft |
Source: Zillow Rentals Report a problem | ||
| 10/8/2026 | Listed for rent | $2,600$1/sqft |
Source: Zillow Rentals Report a problem | ||
| 9/23/2026 | Price change | $920,000-3.2%$209/sqft |
Source:  UtahRealEstate.com #2186867 Report a problem | ||
| 9/8/2026 | Listed for sale | $950,000+22.6%$216/sqft |
Source: Owner Report a problem | ||
| 1/20/2022 | Pending sale | $775,000$176/sqft |
Source: UtahRealEstate.com #1784159 Report a problem | ||
| 12/17/2021 | Listed for sale | $775,000$176/sqft |
Source: UtahRealEstate.com #1784159 Report a problem | ||
Public tax history
| Year | Property taxes | Tax assessment |
|---|---|---|
| 2025 | $4,372 -0.8% | $476,905 +3.6% |
| 2024 | $4,408 -1.5% | $460,295 +4.4% |
| 2023 | $4,474 +6.1% | $440,880 +8.2% |
| 2022 | $4,218 +20.2% | $407,385 +31% |
| 2021 | $3,509 +1% | $310,915 +7.8% |
| 2020 | $3,474 +1% | $288,530 +2.8% |
| 2019 | $3,439 +2.9% | $280,720 +5.6% |
| 2018 | $3,340 +2% | $265,925 -39.1% |
| 2017 | $3,274 +8.5% | $436,600 +3.9% |
| 2016 | $3,016 -1.6% | $420,400 +8.4% |
| 2015 | $3,065 +5.4% | $387,800 +6.2% |
| 2014 | $2,908 | $365,100 +7.2% |
| 2013 | -- | $340,700 +3.3% |
| 2012 | -- | $329,800 -3.1% |
| 2011 | -- | $340,400 +3.8% |
| 2010 | -- | $327,800 -0.9% |
| 2009 | -- | $330,700 -13% |
| 2008 | $2,361 | $380,100 -7.9% |
| 2007 | -- | $412,500 +43.7% |
| 2006 | -- | $287,000 +15.3% |
| 2005 | -- | $248,900 +2.2% |
| 2002 | -- | $243,600 +8.2% |
| 2001 | -- | $225,200 -6.8% |
| 2000 | -- | $241,700 |
Find assessor info on the county website
Monthly payment
Est. payment
Payment breakdown
Explore the cost of this home by adjusting the details. Changes won't be saved.Climate risks
Neighborhood: 84095
- $863,7005 bd5 ba3k sqft1256 W Country Creek Dr, South Jordan, UT 84095Off Market

- $479,9002 bd3 ba2.6k sqft1538 W Wyngate Park Dr, South Jordan, UT 84095Off Market

- $2,894,0005 bd4 ba6.3k sqft9769 S Lazy Water Cv, South Jordan, UT 84095Off Market
- $578,0005 bd3 ba2.3k sqft11582 S Country Farm Road South Jordan #0, Utah, UT 84095Off Market

Similar homes
- $899,0005 bd3 ba4.1k sqft11017 S Via Encantada Way, South Jordan, UT 84095For Sale

 MLS ID #2191427, Lisa I. Montoya, Equity Real Estate (Advantage). UtahRealEstate.com
- $950,0006 bd4 ba4.2k sqft11029 S Alpine Spring Ct, South Jordan, UT 84095For Sale
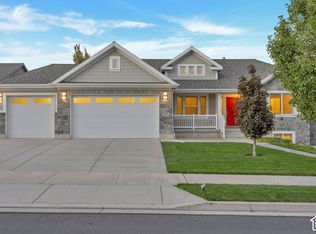 MLS ID #2192308, Jaana E. Bess, Bangerter Brothers Realty, LLC. UtahRealEstate.com
- $949,9986 bd3 ba3.6k sqft3215 W Cameron Ct, South Jordan, UT 84095For Sale
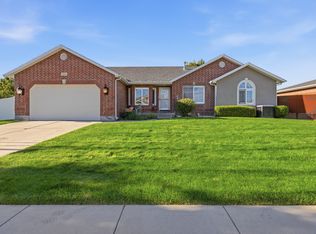 MLS ID #2182291, Therese Owen, RANLife Real Estate Inc. UtahRealEstate.com
- $825,0005 bd4 ba4.3k sqft10964 S Ptarmigan Cv W, South Jordan, UT 84095For Sale
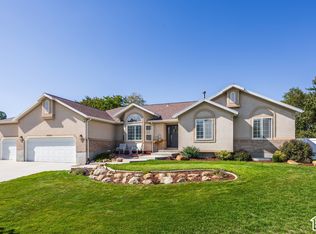 MLS ID #2188361, Tricia P. Vanderkooi, Summit Sotheby's International Realty. UtahRealEstate.com
- $929,9006 bd4 ba3.8k sqft9467 S Overleigh Ct, South Jordan, UT 84095For SaleMLS ID #2190700, Lynn B Buckway, EXIT Realty Success. UtahRealEstate.com
- $944,8005 bd4 ba4.1k sqft3288 W Ephraim Cir, South Jordan, UT 84095For SaleMLS ID #2165785, Andie Ford, EXP Realty, LLC. UtahRealEstate.com
- $919,9005 bd3 ba3.7k sqft1642 W Hunters Creek Cir, South Jordan, UT 84095For SaleMLS ID #2184393, Lance Goddard, Real Estate Essentials. UtahRealEstate.com
- $900,0004 bd3 ba3.7k sqft11549 S Equestrian Dr W, South Jordan, UT 84095For SaleMLS ID #2181179, Wesley J Goldberg, Real Estate Essentials. UtahRealEstate.com
- $1,379,9006 bd5 ba4k sqft2299 W Canterwood Dr, South Jordan, UT 84095For SaleMLS ID #2193063, Benjamin Coon, Equity Real Estate (Solid). UtahRealEstate.com
- $905,0005 bd4 ba4.5k sqft11266 S Palisade View Dr, South Jordan, UT 84095For SaleMLS ID #2165083, Brandon Elizondo, EXP Realty, LLC. UtahRealEstate.com
- $1,079,0006 bd4 ba4.7k sqft3013 W Alta Peak Rd, South Jordan, UT 84095For SaleMLS ID #2192342, Griffen M Cisneros, Real Estate Essentials. UtahRealEstate.com
- $939,9007 bd4 ba4.7k sqft9521 S 1860 W, South Jordan, UT 84095For SaleMLS ID #2167007, Eric T Praag, Homespot Real Estate, LLC. UtahRealEstate.com
- $920,0005 bd4 ba3.9k sqft1623 W Hunters Creek Cir, South Jordan, UT 84095For SaleMLS ID #2179431, Vernon Gubler, Presidio Real Estate (Mountain View). UtahRealEstate.com
- $779,9005 bd3 ba3.4k sqft10321 S 1480 W, South Jordan, UT 84095For SaleMLS ID #2179849, Bryan Colemere, Colemere Realty Associates LLC. UtahRealEstate.com
- $1,085,0005 bd5 ba4.9k sqft10653 S 3210 W, South Jordan, UT 84095For SaleMLS ID #2180659, Joel Carson, Utah Real Estate PC. UtahRealEstate.com
- $849,9995 bd4 ba3.1k sqft9934 S Presidential Dr, South Jordan, UT 84095For SaleMLS ID #2189912, Danny Swett, Equity Real Estate (Bear River). UtahRealEstate.com
- $849,9005 bd3 ba3.4k sqft1376 W Jordan Hills Dr, South Jordan, UT 84095For SaleMLS ID #2164954, Joel Carson, Utah Real Estate PC. UtahRealEstate.com
- $780,0005 bd4 ba3.4k sqft10504 S Highline Cir, South Jordan, UT 84095For SaleMLS ID #2184776, LAMAR A MABEY, LaMar A. Mabey & Associates, Inc.. UtahRealEstate.com
- $950,0007 bd4 ba4k sqft2995 W Springer Ln, South Jordan, UT 84095For SaleMLS ID #2174904, Brooke Bishop, Windermere Real Estate. UtahRealEstate.com
- $890,0005 bd4 ba4.3k sqft3257 W Stoker Cv, South Jordan, UT 84095For SaleMLS ID #2170060, Daniel Talbert, Realtypath LLC. UtahRealEstate.com
