$634,300
3 bd|1 ba|2k sqft
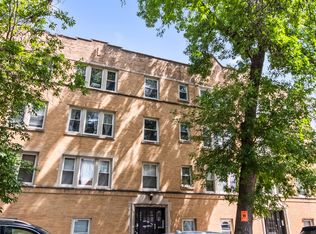
4741 N Paulina St #1, Chicago, IL 60640
Off Market
Zillow last checked:
Stephanie Miller (224)699-5002,
Redfin Corporation
Not available
Estimated sales range
Not available
Not available
| Date | Event | Price |
|---|---|---|
| 2/28/2022 | Sold | $180,000-2.7%$200/sqft |
Source: | ||
| 2/9/2022 | Contingent | $185,000$206/sqft |
Source: | ||
| 2/1/2022 | Listed for sale | $185,000+22.5%$206/sqft |
Source: | ||
| 11/5/2020 | Listing removed | $1,300$1/sqft |
Source: Best Chicago Properties LLC #10854009 Report a problem | ||
| 10/27/2020 | Price change | $1,300-7.1%$1/sqft |
Source: Best Chicago Properties LLC #10854009 Report a problem | ||
| 9/12/2020 | Listed for rent | $1,400$2/sqft |
Source: Best Chicago Properties LLC #10854009 Report a problem | ||
| 9/12/2019 | Listing removed | $1,400$2/sqft |
Source: Best Chicago Properties LLC #10505248 Report a problem | ||
| 9/4/2019 | Listed for rent | $1,400$2/sqft |
Source: Best Chicago Properties LLC #10505248 Report a problem | ||
| 8/20/2014 | Sold | $151,000+29.1%$168/sqft |
Source: | ||
| 4/1/2008 | Sold | $117,000$130/sqft |
Source: Public Record Report a problem | ||
| Year | Property taxes | Tax assessment |
|---|---|---|
| 2024 | -- | $21,448 +19.2% |
| 2023 | $3,098 -16.3% | $17,999 |
| 2022 | $3,702 +2.3% | $17,999 |
| 2021 | $3,619 +13.6% | $17,999 +25.9% |
| 2020 | $3,185 +0.5% | $14,298 -9.3% |
| 2019 | $3,169 +1.7% | $15,772 |
| 2018 | $3,116 +8.5% | $15,772 +18.2% |
| 2017 | $2,872 +7.5% | $13,340 |
| 2016 | $2,672 +9.3% | $13,340 |
| 2015 | $2,445 +12% | $13,340 -6.9% |
| 2014 | $2,182 +2.5% | $14,328 |
| 2013 | $2,128 -17.2% | $14,328 |
| 2012 | $2,571 +0.5% | $14,328 -9.2% |
| 2011 | $2,557 -0.4% | $15,780 |
| 2010 | $2,568 +90.2% | $15,780 |
| 2009 | $1,350 +27.4% | $15,780 +11.2% |
| 2008 | $1,060 +2% | $14,192 |
| 2007 | $1,039 +2% | $14,192 |
| 2006 | $1,019 -19.8% | $14,192 +14.6% |
| 2005 | $1,270 +46.2% | $12,387 |
| 2004 | $869 -9% | $12,387 |
| 2003 | $954 -39.9% | $12,387 +40.1% |
| 2002 | $1,589 +3.8% | $8,842 |
| 2001 | $1,531 +12.1% | $8,842 |
| 2000 | $1,366 -0.7% | $8,842 +24.3% |
| 1999 | $1,375 | $7,111 |
Source: MRED as distributed by MLS GRID. This data may not be complete. We recommend contacting the local school district to confirm school assignments for this home.
A local agent can set up tours, give advice and negotiate with sellers.