$159,000
2 bd|2 ba|960 sqft
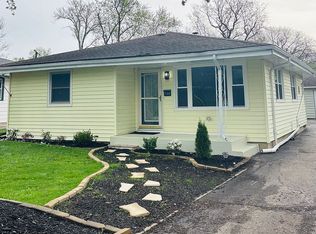
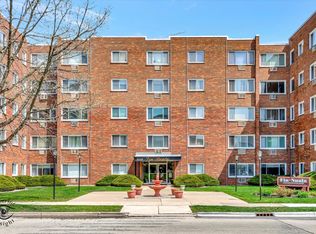
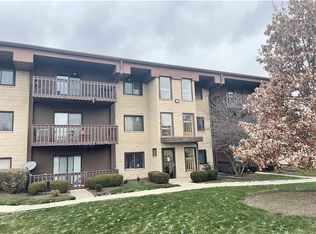
3119 Ingalls Ave APT 3D, Joliet, IL 60435
Sold
Zillow last checked:
Listing updated:
Colleen Basinski (708)740-5883,
Real Broker, LLC
Not available
Estimated sales range
Not available
Not available
| Date | Event | Price |
|---|---|---|
| 6/25/2026 | Listed for sale | $285,000+7.5%$152/sqft |
Source: MRED as distributed by MLS GRID #12684928 Report a problem | ||
| 3/19/2025 | Listing removed | -- |
Source: Owner Report a problem | ||
| 3/19/2025 | Price change | $265,000-1.8%$141/sqft |
Source: Owner Report a problem | ||
| 1/8/2025 | Price change | $269,900-6.6%$144/sqft |
Source: | ||
| 12/23/2024 | Price change | $289,000+4.4%$154/sqft |
Source: Owner Report a problem | ||
| 12/21/2024 | Listed for sale | $276,800-1.8%$147/sqft |
Source: Owner Report a problem | ||
| 12/4/2024 | Listing removed | $282,000$150/sqft |
Source: | ||
| 11/12/2024 | Listed for sale | $282,000-2.8%$150/sqft |
Source: | ||
| 10/22/2024 | Listing removed | $290,000$154/sqft |
Source: | ||
| 10/17/2024 | Price change | $290,000-3.3%$154/sqft |
Source: | ||
| 10/2/2024 | Listed for sale | $299,900-3.3%$160/sqft |
Source: | ||
| 10/1/2024 | Listing removed | $310,000-1.9%$165/sqft |
Source: | ||
| 9/22/2024 | Listed for sale | $316,000+17.7%$168/sqft |
Source: | ||
| 4/1/2024 | Listing removed | -- |
Source: | ||
| 3/1/2024 | Contingent | $268,500$143/sqft |
Source: | ||
| 2/22/2024 | Listed for sale | $268,500-0.6%$143/sqft |
Source: | ||
| 2/19/2024 | Listing removed | -- |
Source: | ||
| 1/26/2024 | Listed for sale | $270,000+1.9%$144/sqft |
Source: | ||
| 1/23/2024 | Listing removed | -- |
Source: | ||
| 1/22/2024 | Price change | $264,900-5.4%$141/sqft |
Source: | ||
| 1/18/2024 | Listed for sale | $279,9000%$149/sqft |
Source: | ||
| 1/17/2024 | Listing removed | -- |
Source: | ||
| 1/14/2024 | Listed for sale | $280,000+21.7%$149/sqft |
Source: | ||
| 10/25/2023 | Sold | $230,000-4.1%$122/sqft |
Source: | ||
| 8/25/2023 | Pending sale | $239,900$128/sqft |
Source: | ||
| 8/22/2023 | Listed for sale | $239,900+160.8%$128/sqft |
Source: | ||
| 6/28/2021 | Sold | $92,000+53.3%$49/sqft |
Source: Public Record Report a problem | ||
| 9/24/2019 | Sold | $60,000-42.3%$32/sqft |
Source: | ||
| 1/16/2004 | Sold | $104,000$55/sqft |
Source: Public Record Report a problem | ||
| Year | Property taxes | Tax assessment |
|---|---|---|
| 2024 | $4,942 -1.6% | $69,001 +22.5% |
| 2023 | $5,023 +6.8% | $56,307 +10.6% |
| 2022 | $4,704 +5.2% | $50,933 +7.1% |
| 2021 | $4,471 +5.4% | $47,570 +5.3% |
| 2020 | $4,242 +22.7% | $45,176 +7.6% |
| 2019 | $3,458 +5.8% | $41,985 +8.2% |
| 2018 | $3,268 -10.3% | $38,796 +10% |
| 2017 | $3,643 +4.4% | $35,272 +8.6% |
| 2016 | $3,490 +3.7% | $32,475 +6.7% |
| 2015 | $3,365 | $30,450 +0.5% |
| 2014 | $3,365 +1.8% | $30,300 -4.5% |
| 2013 | $3,306 -3.7% | $31,735 -12.5% |
| 2012 | $3,435 -1.5% | $36,284 -12.7% |
| 2011 | $3,488 -4.9% | $41,550 -12.7% |
| 2010 | $3,666 -1.3% | $47,580 -9% |
| 2009 | $3,714 +3.7% | $52,290 |
| 2008 | $3,582 | $52,290 +7% |
| 2007 | -- | $48,870 +15% |
| 2006 | $2,681 +12.9% | $42,500 +14.3% |
| 2005 | $2,374 +32.8% | $37,182 +17.9% |
| 2004 | $1,787 +132% | $31,541 +44.7% |
| 2003 | $770 -2.3% | $21,791 +10% |
| 2002 | $789 +2.9% | $19,807 +4% |
| 2001 | $766 +1.9% | $19,048 +3% |
| 2000 | $752 | $18,493 |
Source: MRED as distributed by MLS GRID. This data may not be complete. We recommend contacting the local school district to confirm school assignments for this home.
A local agent can set up tours, give advice and negotiate with sellers.
A local lender can help you make sure your offer is ready when you are.