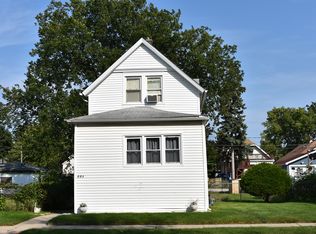
$389,000
4 bd|2 ba|-- sqft
715 S 9th Ave, Maywood, IL 60153
Sold
Zillow last checked:
Listing updated:
Margaret Gancer 708-620-0350,
Compass
Not available
Estimated sales range
Not available
Not available
| Date | Event | Price |
|---|---|---|
| 6/12/2026 | Listed for sale | $195,000$145/sqft |
Source: | ||
| Year | Property taxes | Tax assessment |
|---|---|---|
| 2024 | -- | $22,000 +0% |
| 2023 | $6,907 +121.6% | $21,999 +88.1% |
| 2022 | $3,117 +61.1% | $11,693 |
| 2021 | $1,934 +10.1% | $11,693 |
| 2020 | $1,757 -24.1% | $11,693 +11.1% |
| 2019 | $2,314 -46.9% | $10,522 |
| 2018 | $4,356 -5.7% | $10,522 -5.7% |
| 2017 | $4,620 -29.8% | $11,153 +5.3% |
| 2016 | $6,580 +86.4% | $10,596 |
| 2015 | $3,531 -16.9% | $10,596 |
| 2014 | $4,250 +14.4% | $10,596 +2.8% |
| 2013 | $3,715 -10.6% | $10,309 -10.3% |
| 2012 | $4,157 -13.1% | $11,493 -8.8% |
| 2011 | $4,781 +10.2% | $12,606 -3% |
| 2010 | $4,340 +1.1% | $12,997 |
| 2009 | $4,295 -10.2% | $12,997 -17.2% |
| 2008 | $4,781 +37.5% | $15,694 +34.3% |
| 2007 | $3,477 -2.4% | $11,685 -24.9% |
| 2006 | $3,564 +6.9% | $15,557 +1.1% |
| 2005 | $3,334 -2.7% | $15,395 +32.8% |
| 2004 | $3,429 +3.6% | $11,596 |
| 2003 | $3,310 +10.4% | $11,596 |
| 2002 | $2,999 +54.4% | $11,596 +28.6% |
| 2001 | $1,942 -32.6% | $9,019 |
| 2000 | $2,880 +119.2% | $9,019 |
| 1999 | $1,313 | $9,019 |
Source: MRED as distributed by MLS GRID. This data may not be complete. We recommend contacting the local school district to confirm school assignments for this home.
A local agent can set up tours, give advice and negotiate with sellers.
A local lender can help you make sure your offer is ready when you are.