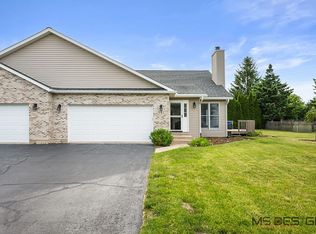
$275,000
3 bd|2 ba|1.6k sqft
309 Terrace Dr, Sycamore, IL 60178
Off Market
Likely to sell faster than
Zillow last checked:
Listing updated:
Gretchen Weber 630-377-1855,
Baird & Warner Fox Valley - Geneva
Not available
Estimated sales range
Not available
Not available
| Date | Event | Price |
|---|---|---|
| 6/15/2026 | Contingent | $250,000$210/sqft |
Source: | ||
| 6/4/2026 | Listed for sale | $250,000+19%$210/sqft |
Source: | ||
| 3/15/2022 | Sold | $210,000$176/sqft |
Source: Public Record Report a problem | ||
| 1/15/2022 | Listed for sale | $210,000+78%$176/sqft |
Source: Owner Report a problem | ||
| 11/21/2018 | Sold | $118,000+2.6%$99/sqft |
Source: Public Record Report a problem | ||
| 9/29/2017 | Sold | $115,000-11.5%$96/sqft |
Source: Public Record Report a problem | ||
| 10/28/2015 | Listing removed | $129,900$109/sqft |
Source: Coldwell Banker Honig-Bell #08877277 Report a problem | ||
| 4/2/2015 | Listed for sale | $129,900-3.8%$109/sqft |
Source: Coldwell Banker Honig-Bell #08877277 Report a problem | ||
| 9/23/2009 | Sold | $135,000-3.5%$113/sqft |
Source: | ||
| 8/1/2009 | Price change | $139,900-3.5%$117/sqft |
Source: CENTURY 21 Elsner Realty #21D2292 Report a problem | ||
| 4/26/2009 | Price change | $144,900-3.3%$122/sqft |
Source: CENTURY 21 Elsner Realty #21D2292 Report a problem | ||
| 3/7/2009 | Price change | $149,900-3.2%$126/sqft |
Source: CENTURY 21 Elsner Realty #21D2292 Report a problem | ||
| 1/22/2009 | Price change | $154,900-3.1%$130/sqft |
Source: CENTURY 21 Elsner Realty #21D2292 Report a problem | ||
| 10/28/2008 | Listed for sale | $159,900+3.8%$134/sqft |
Source: CENTURY 21 Elsner Realty #21D2292 Report a problem | ||
| 11/29/2005 | Sold | $154,000$129/sqft |
Source: Public Record Report a problem | ||
| Year | Property taxes | Tax assessment |
|---|---|---|
| 2024 | $4,601 +1.7% | $61,343 +9.5% |
| 2023 | $4,525 +5.2% | $56,016 +9% |
| 2022 | $4,300 +5.5% | $51,377 +6.5% |
| 2021 | $4,075 +1.6% | $48,232 +2.5% |
| 2020 | $4,010 +1.8% | $47,046 +2.2% |
| 2019 | $3,938 -11.7% | $46,015 +3.1% |
| 2018 | $4,462 +2.2% | $44,619 +4.1% |
| 2017 | $4,365 +2.1% | $42,853 +4.8% |
| 2016 | $4,275 | $40,898 +6.2% |
| 2015 | -- | $38,493 +5.3% |
| 2014 | -- | $36,552 -1.9% |
| 2013 | -- | $37,252 -5.8% |
| 2012 | -- | $39,550 -9.3% |
| 2011 | -- | $43,610 -5% |
| 2010 | -- | $45,925 -4.8% |
| 2009 | -- | $48,256 +3.9% |
| 2008 | -- | $46,463 +4.9% |
| 2007 | -- | $44,301 +7.7% |
| 2006 | -- | $41,130 |
Source: MRED as distributed by MLS GRID. This data may not be complete. We recommend contacting the local school district to confirm school assignments for this home.
A local agent can set up tours, give advice and negotiate with sellers.
A local lender can help you make sure your offer is ready when you are.