$275,000
3 bd|2 ba|1.1k sqft
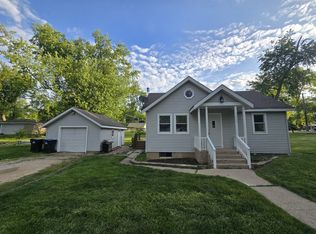
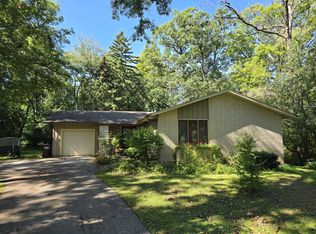
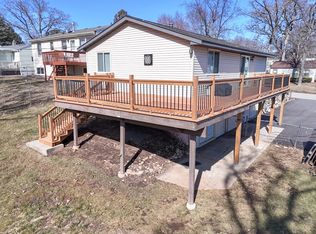
8907 Shady Ln, Wonder Lake, IL 60097
Sold
Zillow last checked:
Listing updated:
Nicole Hodges 815-385-6770,
RE/MAX Plaza
Not available
Estimated sales range
Not available
Not available
| Date | Event | Price |
|---|---|---|
| 6/15/2026 | Pending sale | $315,000$197/sqft |
Source: | ||
| 6/11/2026 | Listed for sale | $315,000+43.2%$197/sqft |
Source: | ||
| 3/20/2023 | Listing removed | -- |
Source: Zillow Rentals Report a problem | ||
| 12/30/2022 | Listed for rent | $2,300$1/sqft |
Source: Zillow Rentals Report a problem | ||
| 8/17/2022 | Listing removed | -- |
Source: | ||
| 6/29/2022 | Listed for sale | $220,000$138/sqft |
Source: | ||
| 6/28/2022 | Pending sale | $220,000$138/sqft |
Source: | ||
| 6/28/2022 | Contingent | $220,000$138/sqft |
Source: | ||
| 6/16/2022 | Listed for sale | $220,000+263.6%$138/sqft |
Source: | ||
| 12/12/2012 | Sold | $60,500-49.6%$38/sqft |
Source: | ||
| 9/19/2010 | Listing removed | $120,000$75/sqft |
Source: Dream Real Estate #07487545 Report a problem | ||
| 8/13/2010 | Price change | $120,000-4%$75/sqft |
Source: Dream Real Estate #07487545 Report a problem | ||
| 7/17/2010 | Price change | $125,000-3.8%$78/sqft |
Source: Dream Real Estate #07487545 Report a problem | ||
| 6/9/2010 | Price change | $130,000-3.7%$81/sqft |
Source: Dream Real Estate #07487545 Report a problem | ||
| 5/1/2010 | Price change | $135,000-3.6%$84/sqft |
Source: Dream Real Estate #07487545 Report a problem | ||
| 4/3/2010 | Listed for sale | $140,000$88/sqft |
Source: Dream Real Estate #07487545 Report a problem | ||
| Year | Property taxes | Tax assessment |
|---|---|---|
| 2024 | $2,685 +1.7% | $35,238 +9.3% |
| 2023 | $2,639 +1.8% | $32,225 +8.7% |
| 2022 | $2,593 +4.1% | $29,645 +7.5% |
| 2021 | $2,491 +2.8% | $27,582 +5.5% |
| 2020 | $2,422 | $26,151 +6.2% |
| 2019 | -- | $24,622 +6.6% |
| 2018 | $2,245 +1.1% | $23,100 +6.5% |
| 2017 | $2,222 -1.6% | $21,680 +6.5% |
| 2016 | $2,258 | $20,353 +0.9% |
| 2013 | $2,258 | $20,165 -54.6% |
| 2011 | -- | $44,388 -13.8% |
| 2010 | -- | $51,470 -5.4% |
| 2009 | -- | $54,391 |
| 2008 | -- | $54,391 +7.2% |
| 2006 | -- | $50,753 +7.6% |
| 2005 | $2,730 +3.9% | $47,159 +7.5% |
| 2004 | $2,627 +1.5% | $43,861 +6.1% |
| 2003 | $2,589 +4% | $41,347 +5.6% |
| 2002 | $2,491 +5.3% | $39,166 +5% |
| 2001 | $2,365 +4.3% | $37,308 +2.3% |
| 2000 | $2,267 | $36,469 |
Source: MRED as distributed by MLS GRID. This data may not be complete. We recommend contacting the local school district to confirm school assignments for this home.
A local agent can set up tours, give advice and negotiate with sellers.