This is a 1802 square foot, 2.0 bathroom, single family home. This home is located at 10526 Quimby Dr, Port Richey, FL 34668.
Pre-foreclosure
Street View
Est. $281,400
10526 Quimby Dr, Port Richey, FL 34668
--beds
2baths
1,802sqft
SingleFamily
Built in 1988
6,534 Square Feet Lot
$281,400 Zestimate®
$156/sqft
$47/mo HOA
Overview
- 54 days
- 296
- 29
Facts & features
Interior
Bedrooms & bathrooms
- Bathrooms: 2
Heating
- Forced air
Cooling
- Central
Features
- Flooring: Carpet, Linoleum / Vinyl
Interior area
- Total interior livable area: 1,802 sqft
Property
Parking
- Parking features: Garage - Attached
Features
- Exterior features: Stucco, Cement / Concrete
Lot
- Size: 6,534 Square Feet
Details
- Parcel number: 1425160190000001260
Construction
Type & style
- Home type: SingleFamily
Materials
- Concrete Block
- Roof: Asphalt
Condition
- Year built: 1988
Community & HOA
HOA
- Has HOA: Yes
- HOA fee: $47 monthly
Location
- Region: Port Richey
Financial & listing details
- Price per square foot: $156/sqft
- Tax assessed value: $270,693
- Annual tax amount: $321
Foreclosure details
Estimated market value
$281,400
$265,000 - $298,000
$2,098/mo
Price history
| Date | Event | Price |
|---|---|---|
| 6/29/2022 | Sold | $288,000-11.4%$160/sqft |
Source: Public Record Report a problem | ||
| 5/16/2022 | Pending sale | $325,000$180/sqft |
Source:  Stellar MLS #T3363494 Report a problem | ||
| 3/30/2022 | Listed for sale | $325,000+225%$180/sqft |
Source: Stellar MLS #T3363494 Report a problem | ||
| 3/8/2012 | Sold | $100,000-38.3%$55/sqft |
Source: Public Record Report a problem | ||
| 5/5/2005 | Sold | $162,000+90.6%$90/sqft |
Source: Public Record Report a problem | ||
| 1/29/1997 | Sold | $85,000-3.6%$47/sqft |
Source: Public Record Report a problem | ||
| 9/16/1993 | Sold | $88,200$49/sqft |
Source: Public Record Report a problem | ||
Public tax history
| Year | Property taxes | Tax assessment |
|---|---|---|
| 2025 | $321 +2.2% | $179,340 +2.9% |
| 2024 | $314 +2.3% | $174,290 |
| 2023 | $307 -90.5% | $174,290 -27.6% |
| 2022 | $3,221 +19.2% | $240,874 +69.5% |
| 2021 | $2,702 +9.1% | $142,130 +10% |
| 2020 | $2,477 +8.4% | $129,210 +10% |
| 2019 | $2,286 | $117,470 -2.5% |
| 2018 | $2,286 +12.3% | $120,533 +8.4% |
| 2017 | $2,036 +6.3% | $111,199 +26% |
| 2016 | $1,916 +24.4% | $88,259 +6.2% |
| 2015 | $1,540 +9.1% | $83,068 +7.2% |
| 2014 | $1,411 | $77,453 +10.1% |
| 2013 | -- | $70,373 +0.7% |
| 2012 | -- | $69,860 -12.2% |
| 2011 | -- | $79,597 -10.6% |
| 2010 | -- | $89,022 -16.3% |
| 2009 | -- | $106,410 -28.3% |
| 2008 | -- | $148,433 -7.1% |
| 2007 | -- | $159,695 +0.7% |
| 2006 | -- | $158,566 +22.1% |
| 2005 | -- | $129,823 +21.7% |
| 2004 | -- | $106,698 +16.8% |
| 2003 | -- | $91,315 +9.1% |
| 2002 | -- | $83,678 +13.8% |
| 2000 | -- | $73,509 |
| 1999 | -- | $73,509 |
Find assessor info on the county website
Monthly payment
Climate risks
Neighborhood: 34668


Similar homes
- $289,9003 bd2 ba1.8k sqft10127 BARNETT LOOP, PORT RICHEY, FL 34668For Sale
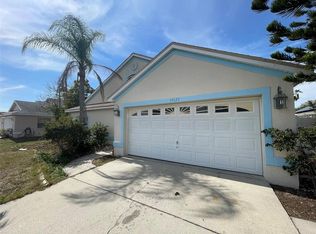
 MLS ID #TB8550632, Meybell Gutierrez, INFINITY REALTY & INVESTMENT. Stellar MLS
- $285,0004 bd3 ba2.2k sqft11633 FOX RUN, PORT RICHEY, FL 34668For Sale
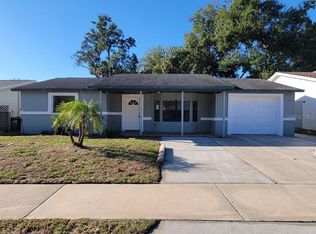 MLS ID #W7887636, Brande Greenlee, GREENLEE REALTY GROUP. Stellar MLS
- $--2 bd2 ba1k sqft9235 Hunt Club Ln, Port Richey, FL 34668Auction
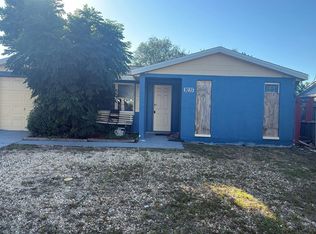 Auction.com 2
- $--2 bd2 ba1k sqft10527 Oak Hill Dr, Port Richey, FL 34668Auction
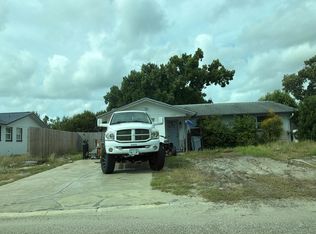 Auction.com 2
- $285,0003 bd2 ba1.6k sqft9401 GLEN MOOR LANE, PORT RICHEY, FL 34668For SaleMLS ID #TB8531105, Lazara Hernandez, BELLA VISTA REALTY GROUP LLC. Stellar MLS
- $289,0002 bd1 ba1k sqft7220 FOX HOLLOW DRIVE, PORT RICHEY, FL 34668For SaleMLS ID #TB8510548, Chandra Dasrat, QUICKSILVER REAL ESTATE GROUP. Stellar MLS
- $249,9002 bd2 ba980 sqft6639 TRIPOLI WAY, PORT RICHEY, FL 34668For SaleMLS ID #O6446530, Ileana Perez, HOUWZER INC. Stellar MLS
- $219,9003 bd2 ba1.5k sqft6135 SEABREEZE DRIVE, PORT RICHEY, FL 34668For SaleMLS ID #TB8506313, Hilary Provost, BRANDYWINE HOMES USA. Stellar MLS
- $210,0002 bd2 ba1.3k sqft9436 GLEN MOOR LANE, PORT RICHEY, FL 34668For SaleMLS ID #TB8536227, Shawn Miller, PREMIER REALTY. Stellar MLS
- $315,0002 bd2 ba1k sqft8402 DAMEN LANE, PORT RICHEY, FL 34668For SaleMLS ID #W7883700, Lindsay Stewart, RELIANCE REALTY & INVESTMENTS. Stellar MLS
- $224,0002 bd1 ba1k sqft9617 LAKE CHRISE LANE, PORT RICHEY, FL 34668For SaleMLS ID #W7881892, John Grey, FI GREY & SON INC COMMERCIAL. Stellar MLS
- $250,0003 bd2 ba1.3k sqft9602 CHRIS STREET, HUDSON, FL 34669For SaleMLS ID #TB8539290, Isabela Morejon Alfonso, BELLA VISTA REALTY GROUP LLC. Stellar MLS
- $275,0003 bd2 ba1.4k sqft4800 FLEETWOOD STREET, NEW PORT RICHEY, FL 34653For SaleMLS ID #TB8561465, Jeffrey Wernick, TAGER REALTY, INC.. Stellar MLS
- $275,0003 bd2 ba1.5k sqft10404 HERON HIDEAWAY LOOP, LAND O LAKES, FL 34638For SaleMLS ID #TB8565053, Jessica Rask, MARK SPAIN REAL ESTATE. Stellar MLS
- $280,0003 bd2 ba1.1k sqft5330 POINSETTIA DRIVE, NEW PORT RICHEY, FL 34652For SaleMLS ID #TB8563339, Otniel Mojarrieta, JPT REALTY LLC. Stellar MLS
- $159,0002 bd1 ba912 sqft9735 RAINBOW LANE, PORT RICHEY, FL 34668For SaleMLS ID #TB8546579, Yousef Bassoumi, LPT REALTY, LLC. Stellar MLS
