This 2677 square foot single family home has 3 bedrooms and 4.0 bathrooms. This home is located at 10323 Bedford Rd, Spring Hill, FL 34608.
Pre-foreclosure
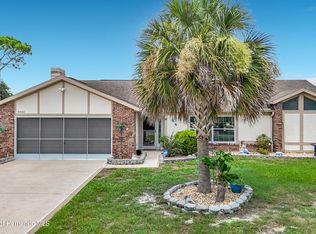
Street View
Est. $398,800
10323 Bedford Rd, Spring Hill, FL 34608
3beds
4baths
2,677sqft
SingleFamily
Built in 1989
0.51 Acres Lot
$398,800 Zestimate®
$149/sqft
$13/mo HOA
Overview
- 72 days |
- 17 |
- 1 |
Facts & features
Interior
Bedrooms & bathrooms
- Bedrooms: 3
- Bathrooms: 4
Heating
- Other
Cooling
- Other
Features
- Flooring: Carpet
Interior area
- Total interior livable area: 2,677 sqft
Property
Parking
- Parking features: Garage
Features
- Exterior features: Stucco, Cement / Concrete
- Has spa: Yes
Lot
- Size: 0.51 Acres
Details
- Parcel number: R2422317282300000580
Construction
Type & style
- Home type: SingleFamily
Materials
- concrete
- Foundation: Footing
- Roof: Metal
Condition
- Year built: 1989
Community & HOA
HOA
- Has HOA: Yes
- HOA fee: $13 monthly
Location
- Region: Spring Hill
Financial & listing details
- Price per square foot: $149/sqft
- Tax assessed value: $371,730
- Annual tax amount: $2,246
Visit our professional directory to find a foreclosure specialist in your area that can help with your home search.
Find a foreclosure agentForeclosure details
Estimated market value
$398,800
$363,000 - $435,000
$3,001/mo
Price history
| Date | Event | Price |
|---|---|---|
| 5/9/2003 | Sold | $189,000$71/sqft |
Source: Public Record Report a problem | ||
Public tax history
| Year | Property taxes | Tax assessment |
|---|---|---|
| 2025 | $2,246 +0.8% | $150,050 +2.9% |
| 2024 | $2,227 +3.9% | $145,821 +3% |
| 2023 | $2,144 +1.1% | $141,574 +3% |
| 2022 | $2,120 +0.7% | $137,450 +3% |
| 2021 | $2,105 +7% | $133,447 +1.4% |
| 2020 | $1,967 | $131,605 +2.3% |
| 2019 | -- | $128,646 +1.9% |
| 2018 | $1,323 -19.3% | $126,247 +2.1% |
| 2017 | $1,638 | $123,650 +2.1% |
| 2016 | $1,638 +3% | $121,107 +0.7% |
| 2015 | $1,590 +1.1% | $120,265 +0.8% |
| 2014 | $1,573 +24.6% | $119,311 +1.5% |
| 2013 | $1,262 -17.1% | $117,548 -8.1% |
| 2012 | $1,523 -7.3% | $127,857 -5.5% |
| 2011 | $1,643 | $135,355 -5.6% |
| 2010 | -- | $143,354 -12.6% |
| 2009 | $2,100 -16.1% | $164,018 -11.5% |
| 2008 | $2,504 -13.6% | $185,229 +5.8% |
| 2006 | $2,900 | $175,155 +3% |
| 2005 | -- | $170,053 +3% |
| 2004 | $2,924 -9.7% | $165,100 +8.8% |
| 2003 | $3,238 +66.4% | $151,745 +30.8% |
| 2002 | $1,946 +0.5% | $115,975 +1.6% |
| 2001 | $1,936 +2.5% | $114,149 -2.8% |
| 2000 | $1,888 | $117,445 |
Find assessor info on the county website
Monthly payment
Climate risks
Neighborhood: Orchard Park
Nearby schools
GreatSchools rating
- 4/10Explorer K-8Grades: PK-8Distance: 1.8 mi
- 4/10Frank W. Springstead High SchoolGrades: 9-12Distance: 1.4 mi
- $380,9003 bd2 ba2.7k sqft10315 Bedford Rd, Spring Hill, FL 34608Off Market
- $343,8003 bd2 ba1.9k sqft10331 Bedford Rd, Spring Hill, FL 34608Off Market
- $375,0003 bd2 ba2k sqft10309 Bedford Rd, Spring Hill, FL 34608Off Market
- $575,0004 bd3 ba2.7k sqft10339 Bedford Rd, Spring Hill, FL 34608For Sale

- $354,0003 bd2 ba1.9k sqft2132 Little Peach Ct, Spring Hill, FL 34608Off Market
- $419,0003 bd2 ba2.1k sqft2124 Little Peach Ct, Spring Hill, FL 34608Off Market
- $379,7003 bd3 ba2.1k sqft2140 Little Peach Ct, Spring Hill, FL 34608Off Market
- $364,0004 bd3 ba2.2k sqft10324 Bedford Rd, Spring Hill, FL 34608Off Market
Similar homes
- $389,9003 bd2 ba2.1k sqft2156 New Azora Rd, Spring Hill, FL 34608For Sale
 MLS ID #2260255, Todd Locascio, Tropic Shores Realty LLC. HCMLS
 - $409,5003 bd2 ba1.9k sqft10433 Dunkirk Rd, Spring Hill, FL 34608For Sale
 MLS ID #2260363, Frances Meyer, REMAX Marketing Specialists. HCMLS
 - $374,9003 bd2 ba1.8k sqft1463 Brigadier Dr, Spring Hill, FL 34608For Sale
 MLS ID #2260236, David H Longspaugh, RE/MAX Sunset Realty. HCMLS
 - $415,0003 bd2 ba2.3k sqft10296 WINDSOR COURT, SPRING HILL, FL 34608For Sale
 MLS ID #W7887057, Gregory Anderson, PA, EXP REALTY LLC. Stellar MLS
 - $410,0003 bd2 ba1.8k sqft2583 Running Oak Ct, Spring Hill, FL 34608For SaleMLS ID #2260159, Ron W Heugel, Peoples Trust Realty Inc. HCMLS
- $419,9003 bd2 ba1.9k sqft2462 STEPHANIE DRIVE, SPRING HILL, FL 34608For SaleMLS ID #TB8524563, Valeria Aliaga, NETWORTH REALTY OF TAMPA, LLC. Stellar MLS
- $440,0003 bd2 ba2.1k sqft11450 LINDEN DRIVE, SPRING HILL, FL 34608For SaleMLS ID #TB8530599, Geidy Aguila Ramirez, JPT REALTY LLC. Stellar MLS
- $389,0003 bd2 ba2.1k sqft1174 MUSCOVY DRIVE, SPRING HILL, FL 34608For SaleMLS ID #TB8522616, Helen Greiner, COASTAL PROPERTIES GROUP INTERNATIONAL. Stellar MLS
- $399,0004 bd3 ba2.3k sqft1382 Larkin Rd, Spring Hill, FL 34608For SaleMLS ID #855846, Tracie Maler, Keller Williams-Elite Partners. Realtors Association of Citrus County
- $--3 bd2 ba1.5k sqft9355 Horizon Dr, Spring Hill, FL 34608AuctionAuction.com 2
- $399,0003 bd2 ba2.1k sqft10381 Sandtrap Dr, Spring Hill, FL 34608For SaleMLS ID #2258852, Robert Boyd, EXP Realty LLC. HCMLS
- $395,0004 bd2 ba2.2k sqft1170 Barger Ave, Spring Hill, FL 34608For SaleMLS ID #2258053, Michael Ulloa, Happy Florida Homes Realty & Property Management. HCMLS
- $399,0003 bd2 ba2k sqft1091 TOURNAMENT DRIVE, SPRING HILL, FL 34608For SaleMLS ID #TB8503123, Gina Marie Holm, REST EASY REALTY POWERED BY SELLSTATE. Stellar MLS
- $429,9004 bd3 ba2.2k sqft1028 ARCHWAY DRIVE, SPRING HILL, FL 34608For SaleMLS ID #W7887719, Kenneth Basteiro, SIRROM REALTY LLC. Stellar MLS
- $370,0003 bd3 ba1.9k sqft10464 Maderia St, Spring Hill, FL 34608For SaleMLS ID #2258867, April Cannon, Century 21 Alliance Realty. HCMLS
- $435,0004 bd2 ba2.2k sqft10390 Audie Brook Dr, Spring Hill, FL 34608For SaleMLS ID #2260047, Robert Boyd, EXP Realty LLC. HCMLS
- $425,0005 bd2 ba2.4k sqft10417 Golfers Way, Spring Hill, FL 34608For SaleMLS ID #853950, Joan Thompson, RE/MAX Realty One. Realtors Association of Citrus County
- $449,7953 bd2 ba1.8k sqft10220 Spring Hill Dr, Spring Hill, FL 34608For Sale By Owner
- $399,9003 bd2 ba1.9k sqft1421 MEREDITH DRIVE, SPRING HILL, FL 34608New ConstructionStellar MLS
- $380,0003 bd2 ba1.7k sqft397 Peach Tree Dr, Spring Hill, FL 34608For SaleMLS ID #2257721, Christina L Botto, Sunbelt Real Estate Florida. HCMLS
