Come on HOME!!
Pre-foreclosure
Est. $1,626,700
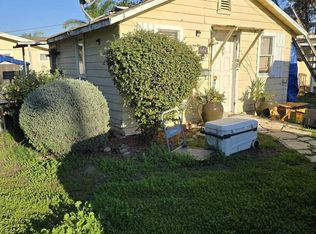
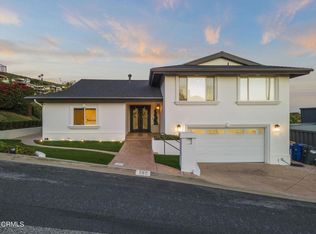
10560 Henderson Rd, Ventura, CA 93004
3beds
3baths
4,450sqft
SingleFamily
Built in 1961
0.52 Acres Lot
$1,626,700 Zestimate®
$366/sqft
$-- HOA
Overview
- 199 days |
- 72 |
- 7 |
Facts & features
Interior
Bedrooms & bathrooms
- Bedrooms: 3
- Bathrooms: 3
Features
- Has fireplace: Yes
Interior area
- Total interior livable area: 4,450 sqft
Property
Parking
- Parking features: Carport
Lot
- Size: 0.52 Acres
Details
- Parcel number: 0890051145
Construction
Type & style
- Home type: SingleFamily
Condition
- Year built: 1961
Community & HOA
Location
- Region: Ventura
Financial & listing details
- Price per square foot: $366/sqft
- Tax assessed value: $1,081,066
- Annual tax amount: $11,816
Visit our professional directory to find a foreclosure specialist in your area that can help with your home search.
Find a foreclosure agentForeclosure details
Estimated market value
$1,626,700
$1.55M - $1.71M
$6,377/mo
Price history
| Date | Event | Price |
|---|---|---|
| 1/16/2020 | Sold | $500,000-44.4%$112/sqft |
Source: Public Record Report a problem | ||
| 3/27/2010 | Listing removed | $899,000$202/sqft |
Source: RE/MAX Gold Coast #90015465 Report a problem | ||
| 3/16/2010 | Listed for sale | $899,000-30.8%$202/sqft |
Source: RE/MAX Gold Coast #90015465 Report a problem | ||
| 11/10/2008 | Listing removed | $1,299,000$292/sqft |
Source: Homes & Land Report a problem | ||
| 6/11/2008 | Listed for sale | $1,299,000$292/sqft |
Source: Homes & Land Report a problem | ||
Public tax history
| Year | Property taxes | Tax assessment |
|---|---|---|
| 2025 | $11,816 +3% | $1,081,066 +2% |
| 2024 | $11,472 | $1,059,869 +2% |
| 2023 | $11,472 +7.6% | $1,039,088 +2% |
| 2022 | $10,658 +1.7% | $1,018,714 +2% |
| 2021 | $10,475 +33% | $998,740 +33.8% |
| 2020 | $7,875 +230.8% | $746,522 +246.7% |
| 2019 | $2,381 +1.6% | $215,305 +2% |
| 2018 | $2,342 +1.8% | $211,085 +2% |
| 2017 | $2,301 +1.7% | $206,947 +2% |
| 2016 | $2,263 +1.6% | $202,891 +1.5% |
| 2015 | $2,228 +1.4% | $199,846 +2% |
| 2014 | $2,198 | $195,933 +0.5% |
| 2013 | -- | $195,050 +2% |
| 2012 | -- | $191,227 +2% |
| 2011 | -- | $187,479 +0.5% |
| 2009 | -- | $186,522 +4% |
| 2007 | -- | $179,282 +2% |
| 2006 | -- | $175,767 +2% |
| 2005 | -- | $172,321 +3.9% |
| 2003 | -- | $165,849 +2% |
| 2002 | -- | $162,598 +2% |
| 2001 | $1,677 +2.3% | $159,411 +2% |
| 2000 | $1,638 | $156,286 |
Find assessor info on the county website
Monthly payment
Estimated monthly payment$1,822
All calculations are estimates and provided by Zillow, Inc. for informational purposes only. Actual amounts may vary.
HOA fees may include property taxes on listings classified as Co-Ops. Contact the listing agent and/or owner for fee details.
Mortgage interest rates are dependent on a number of factors, including credit score, down payment, and repayment length. Interest rate data provided by Zillow Group Marketplace, Inc. as of 1/1/1970 from various mortgage lenders with which we have lead or other similar arrangements; the Estimated Payment is an average of those rates.
See how much you could borrow to make a competitive offer.
Climate risks
Neighborhood: Saticoy
Nearby schools
GreatSchools rating
- 6/10Academy Of Technology & Leadership At SaticoyGrades: K-8Distance: 0.2 mi
- 6/10Buena High SchoolGrades: 9-12Distance: 3.1 mi
- 6/10Balboa Middle SchoolGrades: 6-8Distance: 2.8 mi


- California
- Ventura County
- Ventura
- 93004
- Saticoy
- 10560 Henderson Rd
Nearby cities
Nearby neighborhoods
Nearby zip codes
Other Ventura Topics
