MOTIVATED SELLER! Three-unit multi-family property featuring two occupied units currently occupied. Unit 1-900 a month, unit 3- 700 a month each. With some TLC the rent amount can increase to 1,000 per unit. The second unit is vacant and ready for rehab, offering immediate value-add opportunity and increase rental income potential. Major improvements have already been completed, including a new gutters, new roof, new siding, new windows for all units, new hot water heaters in two units, minimizing large upfront expenses for the next owner. Rents are below market value and could exceed 1,100 with some TLC.
Pending
Price cut: $20K (9/8)
$139,000
111 S Porter St, Michigan City, IN 46360
6beds
--sqft
Triplex
Built in 1900
-- sqft lot
$-- Zestimate®
$--/sqft
$-- HOA
What's special
New guttersNew sidingNew roof
- 171 days
- 67
- 4
Zillow last checked:
Listing updated:
Listed by:
Heather Conley,
@properties/Christie's Intl RE 219-243-2120
Source: NIRA as distributed by MLS GRID,MLS#: 839462
Facts & features
Interior
Bedrooms & bathrooms
- Bedrooms: 6
- Bathrooms: 3
- Full bathrooms: 3
Heating
- Forced Air
Appliances
- Included: Refrigerator
Features
- None
- Basement: Unfinished
- Has fireplace: No
Interior area
- Finished area above ground: 3,670
Property
Parking
- Parking features: Driveway, Gravel
- Has uncovered spaces: Yes
Features
- Levels: One
Lot
- Size: 0.25 Acres
- Features: Back Yard, Private
Details
- Parcel number: 460128458017000022
- Special conditions: None
Construction
Type & style
- Home type: MultiFamily
- Property subtype: Triplex
Condition
- New construction: No
- Year built: 1900
Utilities & green energy
- Sewer: Public Sewer
- Water: Public
Community & HOA
Community
- Subdivision: Cheneys Sub
Location
- Region: Michigan City
Financial & listing details
- Tax assessed value: $66,100
- Annual tax amount: $1,322
- Date on market: 5/23/2026
- Listing agreement: Exclusive Right To Sell
- Listing terms: Cash,Conventional
Estimated market value
Not available
Estimated sales range
Not available
$1,200/mo
Price history
| Date | Event | Price |
|---|---|---|
| 10/9/2026 | Pending sale | $139,000 |
Source:  NIRA as distributed by MLS GRID #839462 Report a problem | ||
| 10/7/2026 | Contingent | $139,000 |
Source: NIRA as distributed by MLS GRID #839462 Report a problem | ||
| 9/8/2026 | Price change | $139,000-12.6% |
Source: NIRA as distributed by MLS GRID #839462 Report a problem | ||
| 8/15/2026 | Price change | $159,000-5.9% |
Source: NIRA as distributed by MLS GRID #839462 Report a problem | ||
| 7/14/2026 | Listed for sale | $169,000 |
Source: NIRA as distributed by MLS GRID #839462 Report a problem | ||
| 6/27/2026 | Contingent | $169,000 |
Source: NIRA as distributed by MLS GRID #839462 Report a problem | ||
| 5/23/2026 | Listed for sale | $169,000+5.7% |
Source: NIRA as distributed by MLS GRID #839462 Report a problem | ||
| 3/9/2026 | Listing removed | $159,900 |
Source: NIRA as distributed by MLS GRID #834089 Report a problem | ||
| 2/16/2026 | Listed for sale | $159,900+185.5% |
Source: NIRA as distributed by MLS GRID #834089 Report a problem | ||
| 1/5/2024 | Sold | $56,000-13.8% |
Source: NIRA as distributed by MLS GRID #539970 Report a problem | ||
| 12/8/2023 | Contingent | $65,000 |
Source: NIRA as distributed by MLS GRID #539970 Report a problem | ||
| 10/10/2023 | Listed for sale | $65,000 |
Source: NIRA as distributed by MLS GRID #539970 Report a problem | ||
Public tax history
| Year | Property taxes | Tax assessment |
|---|---|---|
| 2025 | $1,322 -14% | $67,700 +2.4% |
| 2024 | $1,538 -10% | $66,100 -14% |
| 2023 | $1,708 +24.1% | $76,900 -10% |
| 2022 | $1,376 | $85,400 +24.1% |
| 2021 | $1,376 -18.3% | $68,800 |
| 2020 | $1,684 +19.6% | $68,800 -18.3% |
| 2019 | $1,408 +40.2% | $84,200 +33.2% |
| 2018 | $1,004 -2.1% | $63,200 +47% |
| 2017 | $1,026 +15.5% | $43,000 -2.5% |
| 2016 | $888 -1.1% | $44,100 -1.8% |
| 2014 | $898 +2% | $44,900 +2% |
| 2013 | $880 | $44,000 -17.3% |
| 2010 | -- | $53,200 -23.7% |
| 2006 | $1,538 | $69,700 +14.4% |
| 2005 | -- | $60,900 |
Find assessor info on the county website
Monthly payment
Est. payment
Payment breakdown
Explore the cost of this home by adjusting the details. Changes won't be saved.Climate risks
Neighborhood: 46360


Similar homes
- $134,9003 bd1 ba1.1k sqft719 Cedar St, Michigan City, IN 46360For Sale
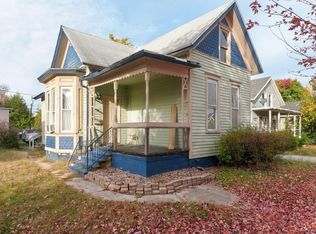
 MLS ID #847659, Vince Kisala, Coldwell Banker Real Estate Gr. NIRA as distributed by MLS GRID
- $169,0003 bd2 ba1.5k sqft118 Dewey St, Michigan City, IN 46360For Sale
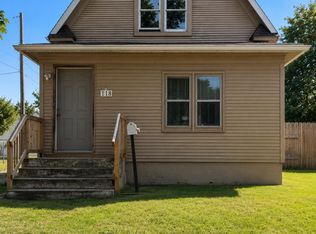 MLS ID #847236, Heather Conley, @properties/Christie's Intl RE. NIRA as distributed by MLS GRID
- $169,9003 bd2 ba1.3k sqft626 Gladys St, Michigan City, IN 46360For Sale
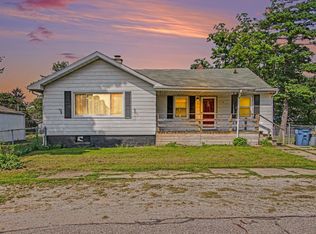 MLS ID #844207, Eric Frageman, Century 21 Circle. NIRA as distributed by MLS GRID
- $--3 bd2 ba1k sqft320 Southwood Dr, Michigan City, IN 46360Auction
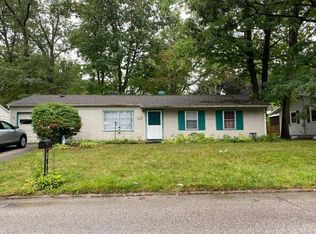 Auction.com 2
- $155,0003 bd1 ba1.7k sqft117 N Calumet Ave, Michigan City, IN 46360For SaleMLS ID #840267, Heather Conley, @properties/Christie's Intl RE. NIRA as distributed by MLS GRID
- $153,9503 bd1 ba864 sqft214 N Pleasant Ave, Michigan City, IN 46360For SaleMLS ID #846288, Adrien Chabot, Prestige Real Estate LLC. NIRA as distributed by MLS GRID
- $189,9005 bd2 ba-- sqft902 Kentucky St, Michigan City, IN 46360For SaleMLS ID #838127, Nathan Tavarez, HomeSmart Realty Group. NIRA as distributed by MLS GRID
- $190,0004 bd1 ba1.5k sqft515 Van Spanje Ave, Michigan City, IN 46360For SaleMLS ID #847817, Alicia Wooten, @properties/Christie's Intl RE. NIRA as distributed by MLS GRID
- $205,0003 bd2 ba-- sqft1107 Maple St, Michigan City, IN 46360For SaleMLS ID #847504, Nora Hess, @properties/Christie's Intl RE. NIRA as distributed by MLS GRID
- $199,9003 bd1 ba1.7k sqft1101 Salem St, Michigan City, IN 46360For SaleMLS ID #848029, Sherry Ritter-Banic, Banic Real Estate & Appraisal. NIRA as distributed by MLS GRID
- $169,0003 bd1 ba1.4k sqft137 E Fulton St, Michigan City, IN 46360For SaleMLS ID #841827, Jasica Twardus, Blackrock Real Estate Services. NIRA as distributed by MLS GRID
- $185,0004 bd2 ba1.6k sqft401 Oak St, Michigan City, IN 46360For SaleMLS ID #843031, Erica Miller, @properties/Christie's Intl RE. NIRA as distributed by MLS GRID
- $180,0004 bd1 ba1.2k sqft326 Ramion Ave, Michigan City, IN 46360For SaleMLS ID #844973, Brittany Kribs, @properties/Christie's Intl RE. NIRA as distributed by MLS GRID
- $189,9994 bd3 ba2.1k sqft209 Roberta Ave, Michigan City, IN 46360For SaleMLS ID #845441, C. Allen Watkins, McColly Real Estate. NIRA as distributed by MLS GRID
- $89,0004 bd3 ba2k sqft1621 W 10th St, Michigan City, IN 46360For SaleMLS ID #835366, Nick Landers, Coldwell Banker Realty. NIRA as distributed by MLS GRID
- $79,9003 bd2 ba1.4k sqft220 Detroit St, Michigan City, IN 46360For SaleMLS ID #847030, Robin Willoughby, MTM Realty Group. NIRA as distributed by MLS GRID
- $199,9994 bd2 ba2.2k sqft609 Black Oak Dr, Michigan City, IN 46360For SaleMLS ID #843044, Edwin Negron, BluKey Realty. NIRA as distributed by MLS GRID
- $199,0003 bd2 ba1.8k sqft215 Wren Pl, Trail Creek, IN 46360For SaleMLS ID #842807, Claudia Forrest, Century 21 Circle. NIRA as distributed by MLS GRID
