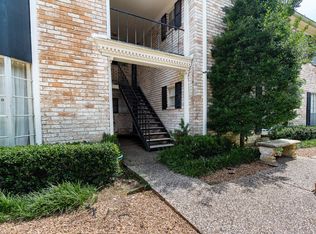
Discover the potential of this 1-bedroom, 1-bathroom condo in the established Westbury Gardens community. Offering approximately 664 sq. ft., this affordable Houston property is worth a closer look for investors seeking their next opportunity or buyers ready to make a property their own.
Bring your proof of funds and schedule your showing today! Buyer to verify property condition, HOA fees, restrictions, and rental eligibility.
For sale
Price increase: $12.5K (10/26)
$97,500
11603 Chimney Rock Rd #4, Houston, TX 77035
1beds
664sqft
Condominium
Built in 1965
-- sqft lot
$91,700 Zestimate®
$147/sqft
$266/mo HOA
What's special
- 173 days
- 35
- 2
Zillow last checked:
Listing updated:
Listed by:
Vanessa Montelongo TREC #0734179 713-291-0566,
Find Realty, LLC
Source: HAR,MLS#: 37008941
Facts & features
Interior
Bedrooms & bathrooms
- Bedrooms: 1
- Bathrooms: 2
- Full bathrooms: 1
- 1/2 bathrooms: 1
Primary bedroom
- Level: First
- Area: 1
- Dimensions: 1x1
Heating
- Electric, Natural Gas
Cooling
- Electric, Gas
Interior area
- Total structure area: 664
- Total interior livable area: 664 sqft
Property
Features
- Levels: One
- Stories: 1
Lot
- Size: 9.44 Acres
Details
- Parcel number: 1134350000004
Construction
Type & style
- Home type: Condo
- Architectural style: Other
- Property subtype: Condominium
Materials
- Other
- Foundation: Other
- Roof: Other
Condition
- New construction: No
- Year built: 1965
Utilities & green energy
- Sewer: Public Sewer
- Water: Public
Community & HOA
Community
- Subdivision: Westbury Gardens Condo
HOA
- HOA fee: $266 monthly
Location
- Region: Houston
Financial & listing details
- Price per square foot: $147/sqft
- Tax assessed value: $80,453
- Annual tax amount: $1,710
- Date on market: 6/1/2026
Estimated market value
$91,700
$87,000 - $96,000
$1,042/mo
Price history
| Date | Event | Price |
|---|---|---|
| 10/26/2026 | Price change | $97,500+14.7%$147/sqft |
Source:  HAR #37008941 Report a problem | ||
| 10/19/2026 | Price change | $84,995-5.6%$128/sqft |
Source: HAR #37008941 Report a problem | ||
| 10/16/2026 | Price change | $89,995-10%$136/sqft |
Source: HAR #37008941 Report a problem | ||
| 9/28/2026 | Price change | $1,295+5.7%$2/sqft |
Source:  HAR #31435139 Report a problem | ||
| 9/28/2026 | Price change | $99,995+4.2%$151/sqft |
Source: HAR #37008941 Report a problem | ||
| 9/21/2026 | Price change | $95,995+6.7%$145/sqft |
Source: HAR #37008941 Report a problem | ||
| 9/9/2026 | Price change | $1,225-5.4%$2/sqft |
Source: HAR #31435139 Report a problem | ||
| 9/9/2026 | Price change | $89,995-5.3%$136/sqft |
Source: HAR #37008941 Report a problem | ||
| 8/24/2026 | Price change | $94,995-5%$143/sqft |
Source: HAR #37008941 Report a problem | ||
| 8/3/2026 | Price change | $99,995+5.3%$151/sqft |
Source: HAR #37008941 Report a problem | ||
| 7/21/2026 | Price change | $94,995-5%$143/sqft |
Source: HAR #37008941 Report a problem | ||
| 7/14/2026 | Price change | $1,295-9.1%$2/sqft |
Source: HAR #31435139 Report a problem | ||
| 7/14/2026 | Price change | $99,995-4.8%$151/sqft |
Source: HAR #37008941 Report a problem | ||
| 7/1/2026 | Price change | $104,995+5%$158/sqft |
Source: HAR #37008941 Report a problem | ||
| 6/30/2026 | Price change | $1,425+11.8%$2/sqft |
Source: HAR #31435139 Report a problem | ||
| 6/27/2026 | Price change | $1,275+27.8%$2/sqft |
Source: HAR #31435139 Report a problem | ||
| 6/27/2026 | Price change | $99,995-4.8%$151/sqft |
Source: HAR #37008941 Report a problem | ||
| 6/1/2026 | Listed for sale | $104,995$158/sqft |
Source: HAR #37008941 Report a problem | ||
| 5/23/2024 | Listing removed | -- |
Source: HAR #57362429 Report a problem | ||
| 5/12/2024 | Price change | $998-15.1%$2/sqft |
Source: HAR #57362429 Report a problem | ||
| 5/10/2024 | Price change | $1,175+7.3%$2/sqft |
Source: HAR #57362429 Report a problem | ||
| 5/6/2024 | Price change | $1,095-2.7%$2/sqft |
Source: HAR #57362429 Report a problem | ||
| 5/5/2024 | Price change | $1,125-5.9%$2/sqft |
Source: HAR #57362429 Report a problem | ||
| 5/2/2024 | Listed for rent | $1,195$2/sqft |
Source: HAR #57362429 Report a problem | ||
| 9/15/2021 | Sold | -- |
Source: Agent Provided Report a problem | ||
Public tax history
| Year | Property taxes | Tax assessment |
|---|---|---|
| 2025 | $1,710 +16.4% | $80,453 +14.6% |
| 2024 | $1,469 +132.3% | $70,214 |
| 2023 | $633 -8.2% | $70,214 +12.3% |
| 2022 | $689 | $62,507 +40.2% |
| 2021 | -- | $44,577 -7.4% |
| 2020 | -- | $48,121 |
| 2019 | $1,165 +15.3% | $48,121 +20.3% |
| 2018 | $1,011 | $40,000 |
| 2017 | $1,011 -0.1% | $40,000 -11.1% |
| 2016 | $1,011 +44.9% | $44,992 +49.3% |
| 2015 | $698 | $30,144 +11% |
| 2014 | $698 | $27,146 -0.6% |
| 2013 | -- | $27,310 +5.9% |
| 2012 | -- | $25,800 +61.3% |
| 2011 | -- | $16,000 |
| 2010 | -- | $16,000 -48.6% |
| 2009 | -- | $31,141 -20.6% |
| 2008 | -- | $39,199 |
| 2007 | -- | $39,199 +19.3% |
| 2006 | -- | $32,847 |
| 2005 | -- | -- |
Find assessor info on the county website
Monthly payment
Est. payment
Payment breakdown
Explore the cost of this home by adjusting the details. Changes won't be saved.Climate risks
Neighborhood: Westbury
Nearby schools
Schools provided by the listing agent
- Elementary: Parker Elementary School (Houston)
- Middle: Meyerland Middle School
- High: Westbury High School
Source: HAR. This data may not be complete. We recommend contacting the local school district to confirm school assignments for this home.
- $90,1002 bd2 ba952 sqft11607 Chimney Rock Rd APT C, Houston, TX 77035Off Market

- $65,4001 bd1 ba644 sqft11609 Chimney Rock Rd #17D, Houston, TX 77035Off Market
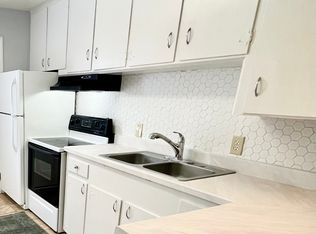
- $89,8002 bd1 ba916 sqft11611 Chimney Rock Rd #19, Houston, TX 77035Off Market
- $1,2202 bd1 ba916 sqft11611 Chimney Rock Rd APT B, Houston, TX 77035For Rent
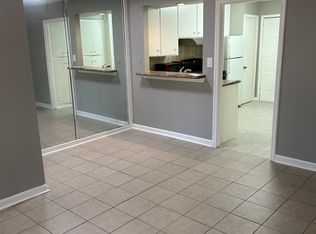
Similar homes
- $100,0001 bd1 ba744 sqft5202 Arboles Dr APT 3, Houston, TX 77035For Sale
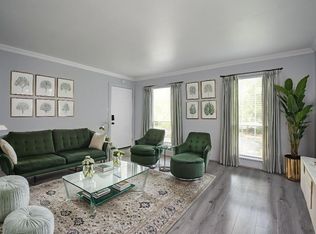 MLS ID #84528243, Todd Patin, RE/MAX Signature. HAR
- $100,0001 bd1 ba744 sqft5230 Arboles Dr #4, Houston, TX 77035For Sale
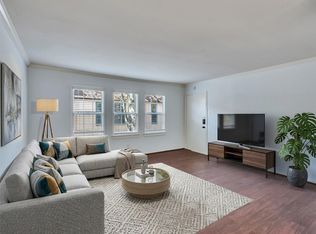 MLS ID #66332034, Todd Patin, RE/MAX Signature. HAR
- $105,0001 bd1 ba773 sqft7900 Westheimer Rd APT 216, Houston, TX 77063For Sale
 MLS ID #26002122, Michael Seder, eXp Realty LLC. HAR
- $95,0002 bd2 ba936 sqft7714 Renwick Dr APT 23, Houston, TX 77081For Sale
 MLS ID #50343125, Sarah Farhi, Coldwell Banker Realty - Bellaire-Metropolitan. HAR
