Handyman special! Instant Equity! Bring your vision and unlock the potential of this South Weymouth Gem! This spacious homes offers an excellent layout, a detached 2-car garage, and an oversized lot with a large yard, making it a standout opportunity for investors, contractors, or buyers looking to build equity. The existing floor plan provides a great foundation for a renovation, while the generous lot and detached garage add even more appeal. With an estimated after-repair value of $780,000+, this is an opportunity to take a property with tremendous potential and transform it into something special. Amazing location in South Weymouth. Don't miss your chance to capitalize on this amazing value-add opportunity!
For sale
$499,777
139 Union St, Weymouth, MA 02190
3beds
1,980sqft
Single Family Residence
Built in 1923
0.58 Acres Lot
$567,200 Zestimate®
$252/sqft
$-- HOA
What's special
Spacious homeOversized lotLarge yard
- 16 days
- 2,899
- 184
Likely to sell faster than
Zillow last checked:
Listing updated:
Listed by:
Liam Coonahan 484-566-5060,
Real Broker MA, LLC 855-450-0442
Source: MLS PIN,MLS#: 73591788
Facts & features
Interior
Bedrooms & bathrooms
- Bedrooms: 3
- Bathrooms: 2
- Full bathrooms: 2
Heating
- Baseboard, Oil
Cooling
- None
Features
- Basement: Full
- Has fireplace: No
Interior area
- Total structure area: 1,980
- Total interior livable area: 1,980 sqft
- Finished area above ground: 1,980
Property
Parking
- Total spaces: 4
- Parking features: Detached
- Garage spaces: 2
- Uncovered spaces: 2
Lot
- Size: 0.58 Acres
- Features: Other
Details
- Parcel number: M:0050 B:0566 L:00100,284911
- Zoning: M-2
Construction
Type & style
- Home type: SingleFamily
- Architectural style: Bungalow
- Property subtype: Single Family Residence
Materials
- Foundation: Concrete Perimeter
Condition
- Year built: 1923
Utilities & green energy
- Sewer: Public Sewer
- Water: Public
Community & HOA
HOA
- Has HOA: No
Location
- Region: Weymouth
Financial & listing details
- Price per square foot: $252/sqft
- Tax assessed value: $535,000
- Annual tax amount: $5,414
- Date on market: 10/20/2026
Estimated market value
$567,200
$516,000 - $641,000
$4,265/mo
Price history
| Date | Event | Price |
|---|---|---|
| 10/20/2026 | Listed for sale | $499,777$252/sqft |
Source: MLS PIN #73591788 Report a problem | ||
Public tax history
| Year | Property taxes | Tax assessment |
|---|---|---|
| 2025 | $5,315 +3.2% | $526,200 +4.9% |
| 2024 | $5,152 +3.3% | $501,700 +5.1% |
| 2023 | $4,987 -4.7% | $477,200 +4.5% |
| 2022 | $5,231 +5.9% | $456,500 +8.5% |
| 2021 | $4,940 +3.5% | $420,800 +5.1% |
| 2020 | $4,772 -0.4% | $400,300 +1.2% |
| 2019 | $4,793 +2.9% | $395,500 +6.2% |
| 2018 | $4,656 +4.2% | $372,500 +6.8% |
| 2017 | $4,467 +4% | $348,700 +3.9% |
| 2016 | $4,294 +8.8% | $335,500 +9.7% |
| 2015 | $3,945 -1.2% | $305,800 +1.9% |
| 2014 | $3,993 +0.2% | $300,200 -2.6% |
| 2013 | $3,984 +2% | $308,100 -4.2% |
| 2012 | $3,904 +3.3% | $321,600 -0.5% |
| 2011 | $3,778 +2.3% | $323,200 -14.3% |
| 2010 | $3,692 | $377,100 |
| 2009 | $3,692 +2.7% | $377,100 -2.6% |
| 2008 | $3,596 +4.4% | $387,100 +2% |
| 2007 | $3,443 +1.6% | $379,600 |
| 2006 | $3,390 +3.6% | $379,600 +2.7% |
| 2005 | $3,271 +8.3% | $369,600 +55.4% |
| 2004 | $3,019 +2.9% | $237,900 |
| 2003 | $2,933 +2.2% | $237,900 |
| 2002 | $2,869 +5% | $237,900 +32.8% |
| 1999 | $2,733 | $179,100 |
Find assessor info on the county website
Monthly payment
Est. payment
Payment breakdown
Explore the cost of this home by adjusting the details. Changes won't be saved.Climate risks
Neighborhood: South Weymouth
Similar homes
- $590,0003 bd2 ba1.6k sqft165 King Philip St, Weymouth, MA 02190For Sale
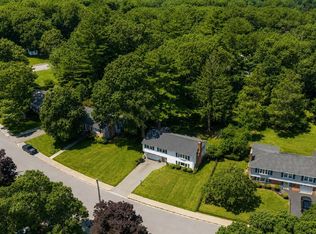 MLS ID #73597777, Kade Phillips, RE/MAX Legacy. MLS PIN
- $695,0004 bd2 ba1.9k sqft195 Union St, Weymouth, MA 02190For Sale
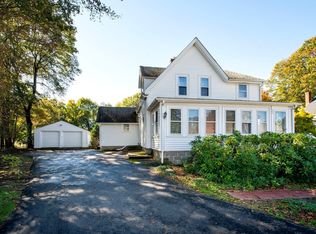 MLS ID #73589866, Susan Solis, Keller Williams Realty Signature Properties. MLS PIN
- $--3 bd2 ba1.6k sqft40 Homestead Ave, Weymouth, MA 02188Auction
 Auction.com 1
- $600,0004 bd3 ba1.9k sqft43 Chisholm Rd, Weymouth, MA 02190For Sale
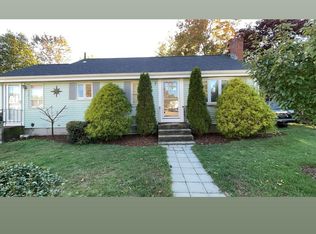 MLS ID #73591633, Kurtis Bonnet, CM Realty Associates. MLS PIN
