Investment Opportunity!!! Add this 3-bedroom ranch to your portfolio! Tenant in place generating $900/month on a Section 8 lease. Solid buy-and-hold option. Sold as-is. Showings only with accepted offer - please respect tenant privacy.
For sale
$66,000
15847 Blackstone St, Detroit, MI 48223
3beds
1,162sqft
Single Family Residence
Built in 1938
4,791 Square Feet Lot
$-- Zestimate®
$57/sqft
$-- HOA
What's special
- 64 days
- 50
- 0
Zillow last checked:
Listing updated:
Listed by:
Bailee Clanton 313-774-4005,
Home Source Realty LLC 313-384-5731
Source: Realcomp II,MLS#: 20261065580
Facts & features
Interior
Bedrooms & bathrooms
- Bedrooms: 3
- Bathrooms: 1
- Full bathrooms: 1
Bedroom
- Level: Entry
- Area: 144
- Dimensions: 12 X 12
Bedroom
- Level: Entry
- Area: 110
- Dimensions: 11 X 10
Bedroom
- Level: Entry
- Area: 110
- Dimensions: 11 X 10
Other
- Level: Entry
Dining room
- Level: Entry
- Area: 100
- Dimensions: 10 X 10
Kitchen
- Level: Entry
- Area: 140
- Dimensions: 14 X 10
Living room
- Level: Entry
- Area: 168
- Dimensions: 14 X 12
Heating
- Forced Air, Natural Gas
Features
- Basement: Unfinished
- Has fireplace: No
Interior area
- Total interior livable area: 1,162 sqft
- Finished area above ground: 1,162
Property
Parking
- Parking features: No Garage
Features
- Levels: One
- Stories: 1
- Entry location: GroundLevel
- Pool features: None
Lot
- Size: 4,791 Square Feet
- Dimensions: 42 x 113.95
Details
- Parcel number: W22I109332S
- Special conditions: Short Sale No,Standard
Construction
Type & style
- Home type: SingleFamily
- Architectural style: Ranch
- Property subtype: Single Family Residence
Materials
- Aluminum Siding, Other
- Foundation: Basement, Block
Condition
- New construction: No
- Year built: 1938
Utilities & green energy
- Sewer: Public Sewer
- Water: Public
Community & HOA
Community
- Subdivision: WASHINGTON GARDENS 3
HOA
- Has HOA: No
Location
- Region: Detroit
Financial & listing details
- Price per square foot: $57/sqft
- Tax assessed value: $23,930
- Annual tax amount: $2,194
- Date on market: 8/18/2026
- Cumulative days on market: 64 days
- Listing agreement: Exclusive Right To Sell
- Listing terms: Cash,Conventional,Warranty Deed
Estimated market value
Not available
Estimated sales range
Not available
$1,225/mo
Price history
| Date | Event | Price |
|---|---|---|
| 8/18/2026 | Listed for sale | $66,000-17.5%$57/sqft |
Source:  Realcomp II #20261065580 Report a problem | ||
| 8/20/2021 | Sold | $80,000+788.9%$69/sqft |
Source: Public Record Report a problem | ||
| 6/3/2021 | Sold | $9,000+50%$8/sqft |
Source: Public Record Report a problem | ||
| 1/21/2020 | Listing removed | $6,000$5/sqft |
Source: RE/MAX Leading Edge #219100439 Report a problem | ||
| 1/13/2020 | Listed for sale | $6,000$5/sqft |
Source: RE/MAX Leading Edge #219100439 Report a problem | ||
| 1/13/2020 | Pending sale | $6,000$5/sqft |
Source: RE/MAX Leading Edge #219100439 Report a problem | ||
| 12/4/2019 | Listed for sale | $6,000-40%$5/sqft |
Source: RE/MAX Leading Edge #219100439 Report a problem | ||
| 3/3/2019 | Listed for sale | $10,000+4.3%$9/sqft |
Source: RE/MAX Leading Edge #219017723 Report a problem | ||
| 6/11/2018 | Sold | $9,585$8/sqft |
Source: Public Record Report a problem | ||
| 3/13/2018 | Listing removed | $9,585-5.3%$8/sqft |
Source: Auction.com Report a problem | ||
| 9/19/2017 | Listed for sale | -- |
Source: Auction.com Report a problem | ||
| 8/7/2017 | Sold | $10,125-84.9%$9/sqft |
Source: Public Record Report a problem | ||
| 6/17/2002 | Sold | $67,000+378.6%$58/sqft |
Source: Public Record Report a problem | ||
| 4/19/2002 | Sold | $14,000-58.8%$12/sqft |
Source: Public Record Report a problem | ||
| 3/20/2001 | Sold | $34,000+466.7%$29/sqft |
Source: Public Record Report a problem | ||
| 12/29/1994 | Sold | $6,000$5/sqft |
Source: Public Record Report a problem | ||
Public tax history
| Year | Property taxes | Tax assessment |
|---|---|---|
| 2025 | -- | $31,400 +24.1% |
| 2024 | -- | $25,300 +23.4% |
| 2023 | -- | $20,500 +35.8% |
| 2022 | -- | $15,100 +14.4% |
| 2021 | -- | $13,200 |
| 2020 | $1,651 +186% | $13,200 +33.3% |
| 2019 | $577 | $9,900 +26.9% |
| 2018 | $577 | $7,800 +8.3% |
| 2017 | -- | $7,200 +41.2% |
| 2016 | $724 | $5,100 |
| 2015 | $724 +12.5% | $5,100 -20.8% |
| 2013 | $644 -11.1% | $6,436 -30.2% |
| 2010 | $724 | $9,222 -12% |
| 2009 | -- | $10,479 -13.5% |
| 2008 | -- | $12,114 |
| 2007 | -- | $12,114 +5.5% |
| 2005 | $135 | $11,482 +3% |
| 2004 | -- | $11,148 +30.4% |
| 2001 | $556 +12.2% | $8,547 +3.2% |
| 2000 | $496 | $8,282 |
Find assessor info on the county website
Monthly payment
Est. payment
Payment breakdown
Explore the cost of this home by adjusting the details. Changes won't be saved.Climate risks
Neighborhood: Brightmoor
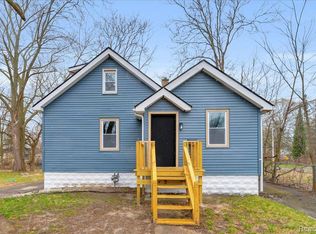

Similar homes
- $--2 bd1 ba913 sqft15755 Stout St, Detroit, MI 48223Auction
 ServiceLink Auction
- $60,0003 bd2 ba1.2k sqft13932 Plainview Ave, Detroit, MI 48223For Sale

 MLS ID #20261082059, Iman Elsibai, Keller Williams Legacy. Realcomp II
- $65,0003 bd1 ba874 sqft11717 W Outer Dr, Detroit, MI 48223For Sale
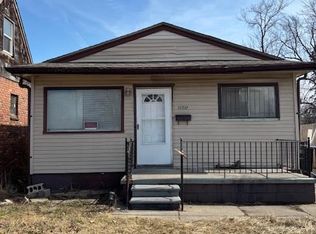 MLS ID #20261082632, Tyraa Caldwell, Tyraa Nicole Realtors LLC. Realcomp II
- $66,3583 bd1 ba909 sqft15889 Bramell St, Detroit, MI 48223For Sale
 MLS ID #20261014450, Greg Majewski, Detroit Investment Company. Realcomp II
- $74,9003 bd2 ba1k sqft15519 Westbrook St, Detroit, MI 48223For SaleMLS ID #20261010210, Greg Majewski, Detroit Investment Company. Realcomp II
- $70,0003 bd1 ba971 sqft14387 Auburn St, Detroit, MI 48223For SaleMLS ID #20261076605, Willie E Harris Jr, Key Realty-Ann Arbor. Realcomp II
- $52,5003 bd2 ba917 sqft22522 Argus, Detroit, MI 48219For SaleMLS ID #20261085487, Mark Hutter, Detroit Investment Company. Realcomp II
- $69,9003 bd2 ba1.1k sqft17256 Pierson St, Detroit, MI 48219For SaleMLS ID #20261065503, Justin Fontenelle, Realtyflo Inc. Realcomp II
- $75,0003 bd1 ba1.3k sqft15371 Heyden St, Detroit, MI 48223For SaleMLS ID #20261038588, Kenneth F Evans, Reach Realty Group. Realcomp II
- $63,9002 bd1 ba800 sqft14055 Plainview Ave, Detroit, MI 48223For Sale
 MLS ID #50212867, Tamara E Leever, Keller Williams Realty Lakeside. MiRealSource
- $62,9002 bd1 ba951 sqft19271 Houghton St, Detroit, MI 48219For SaleMLS ID #20261084435, Michael Lawrence, First Harvest Real Estate Co. Realcomp II
- $52,9002 bd1 ba736 sqft14024 Lamphere St, Detroit, MI 48223For SaleMLS ID #20261084655, Heather Dell, RE/MAX Leading Edge. Realcomp II
- $72,5003 bd1 ba1.1k sqft18445 Grandville Ave, Detroit, MI 48219For SaleMLS ID #20261082545, Jeanette C Lucy, IQ Properties LLC. Realcomp II
- $75,0003 bd1 ba1.1k sqft17275 Braile St, Detroit, MI 48219For Sale
 MLS ID #26054774, Anita Martin, Team LBR LLC. MichRIC
- $75,0003 bd1 ba1.3k sqft16881 Burgess, Detroit, MI 48219For SaleMLS ID #20261082619, Joaquin Oyuela Marcovich, Realtyflo Inc. Realcomp II
- $64,9003 bd1 ba990 sqft19341 Blackstone St, Detroit, MI 48219For SaleMLS ID #20261077266, Rerhi Onomake, Community Choice Realty Inc. Realcomp II
- $69,9003 bd1 ba980 sqft18344 Shiawassee Dr, Detroit, MI 48219For SaleMLS ID #20261076462, Michael Coury, 3Sixty5 Realty. Realcomp II
- $59,0002 bd1 ba687 sqft13590 Minock St, Detroit, MI 48223For SaleMLS ID #20261079571, David Rabior, Clyde Realty LLC. Realcomp II
- $70,0003 bd1 ba763 sqft18659 Shaftsbury Ave, Detroit, MI 48219For SaleMLS ID #20261080241, Jessica Garner, @properties Christie's Int'l R.E. Royal Oak. Realcomp II
- $69,0003 bd1 ba1k sqft17634 Westbrook St, Detroit, MI 48219For SaleMLS ID #20261066282, Maricela Meza, Realty of America. Realcomp II
