This home is a Real Estate Owned (REO)/Post Foreclosure. Once a lender has foreclosed on a property it is soon put up for public auction. If bids fall short of the asking price the bank will buy back the home and attempt to sell it on the open market. However, lenders are not real estate agents, meaning that they will often accept offers 30 to 60 percent less than market value!
Pre-foreclosure
Street View
Est. $380,300
1607 Meadows Ave, Fernley, NV 89408
3beds
2baths
1,560sqft
SingleFamily
Built in 2003
6,098 Square Feet Lot
$380,300 Zestimate®
$244/sqft
$-- HOA
Overview
- 48 days
- 12
- 0
Facts & features
Interior
Bedrooms & bathrooms
- Bedrooms: 3
- Bathrooms: 2
Interior area
- Total interior livable area: 1,560 sqft
Property
Parking
- Parking features: Garage - Attached
Lot
- Size: 6,098 Square Feet
Details
- Parcel number: 02086405
Construction
Type & style
- Home type: SingleFamily
Condition
- Year built: 2003
Community & HOA
Location
- Region: Fernley
Financial & listing details
- Price per square foot: $244/sqft
- Tax assessed value: $296,539
- Annual tax amount: $1,770
Foreclosure details
Estimated market value
$380,300
$361,000 - $399,000
$2,247/mo
Price history
| Date | Event | Price |
|---|---|---|
| 9/11/2009 | Sold | $106,000+23.3%$68/sqft |
Source: Public Record Report a problem | ||
| 7/3/2009 | Price change | $86,000-57%$55/sqft |
Source: foreclosure.com Report a problem | ||
| 6/29/2009 | Listed for sale | -- |
Source: foreclosure.com Report a problem | ||
| 6/4/2009 | Sold | $199,787+101.8%$128/sqft |
Source: Public Record Report a problem | ||
| 5/14/2009 | Listed for sale | $99,000-62.1%$63/sqft |
Source: Listhub #90007003 Report a problem | ||
| 8/29/2005 | Sold | $261,000$167/sqft |
Source: Public Record Report a problem | ||
Public tax history
| Year | Property taxes | Tax assessment |
|---|---|---|
| 2025 | $1,770 +1.9% | $103,789 -0.4% |
| 2024 | $1,738 +4.1% | $104,201 +3.8% |
| 2023 | $1,669 +0.7% | $100,401 +4.5% |
| 2022 | $1,657 | $96,087 +12.1% |
| 2021 | -- | $85,734 +2.8% |
| 2020 | $1,616 | $83,439 +6.3% |
| 2019 | $1,616 +1.2% | $78,525 +17.3% |
| 2018 | $1,597 +2% | $66,938 +13.3% |
| 2017 | $1,566 +0% | $59,073 +29.5% |
| 2016 | $1,565 +10.5% | $45,629 +27% |
| 2015 | $1,416 +2.2% | $35,939 +30.5% |
| 2014 | $1,386 | $27,547 -6.2% |
| 2013 | -- | $29,359 |
| 2012 | -- | $29,359 -14.9% |
| 2011 | -- | $34,514 +10.3% |
| 2010 | -- | $31,296 -40.7% |
| 2009 | -- | $52,799 -14% |
| 2008 | -- | $61,396 +1.2% |
| 2007 | -- | $60,647 +18.4% |
| 2006 | -- | $51,215 +16.4% |
| 2004 | -- | $43,997 |
Find assessor info on the county website
Monthly payment
Climate risks
Neighborhood: 89408


Similar homes
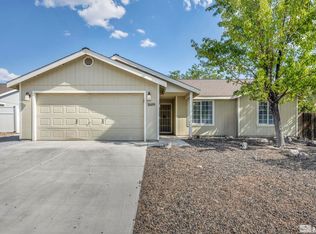
- $--3 bd2 ba1.8k sqft1164 Mountain Rose Dr, Fernley, NV 89408Auction
 ServiceLink Auction
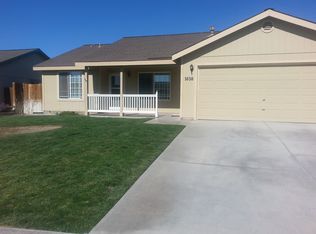
- $400,0003 bd2 ba1.5k sqft898 Julia Ln, Fernley, NV 89408Active
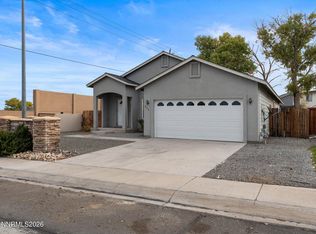
 MLS ID #260013754, Michelle Barney, Century 21 Prime Nevada Prime Real Estate LLC. NNRMLS
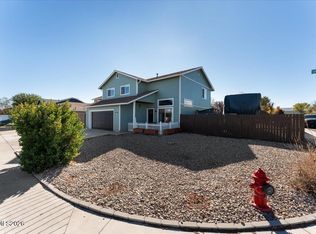
- $394,9004 bd2 ba1.4k sqft128 Relief Springs Rd, Fernley, NV 89408Active
 MLS ID #260007953, Christopher Stapleton, Benchmark Realty. NNRMLS
- $415,0003 bd3 ba1.7k sqft122 Desert Springs Ln, Fernley, NV 89408Active
 MLS ID #260013582, Leslie Henderson, Call It Closed International Realty. NNRMLS
- $385,0003 bd2 ba1.2k sqft45 Arrow St, Fernley, NV 89408ActiveMLS ID #260011564, Kristi Maxwell, Realty One Group Eminence. NNRMLS
- $449,9003 bd2 ba1.6k sqft1623 Summerwind Dr, Fernley, NV 89408ActiveMLS ID #260013661, Daniel McCreary, RE/MAX Traditions. NNRMLS
- $425,0003 bd2 ba1.6k sqft505 Wedge Ln, Fernley, NV 89408ActiveMLS ID #260013556, Claire Mulder, Coldwell Banker Select Fernley. NNRMLS
- $380,0003 bd2 ba1.4k sqft409 Sierra St, Fernley, NV 89408ActiveMLS ID #260006919, Stephen Williams, eXp Realty, LLC. NNRMLS
- $427,0003 bd2 ba1.6k sqft1737 Autumn Glen St, Fernley, NV 89408ActiveMLS ID #260009915, Bryan Shipley, Fathom Realty. NNRMLS
- $404,9003 bd2 ba1.5k sqft1450 Truckee Ln, Fernley, NV 89408ActiveMLS ID #260011193, Steven Foster, eXp Realty. NNRMLS
- $455,0004 bd2 ba1.8k sqft931 Jill Marie Ln, Fernley, NV 89408ActiveMLS ID #260013469, Meka Reade, Real Broker LLC. NNRMLS
- $524,9004 bd2 ba1.9k sqft2550 Emerson Cir, Fernley, NV 89408ActiveMLS ID #260013640, Jessica Stanger, RE/MAX Traditions. NNRMLS
- $315,0002 bd1 ba836 sqft600 Miller Ln, Fernley, NV 89408ActiveMLS ID #260013747, Eric Stanger, RE/MAX Traditions. NNRMLS
- $495,0003 bd2 ba1.2k sqft1006 Opal Way, Fernley, NV 89408ActiveMLS ID #260012439, Jake Kellames, Chase International-Damonte. NNRMLS
- $420,0003 bd2 ba1.4k sqft1692 Picetti Way, Fernley, NV 89408ActiveMLS ID #260010167, Jonathan Lanuza-Gonzalez, Real Broker LLC. NNRMLS
- $349,0003 bd2 ba1.6k sqft770 Scott Dr, Fernley, NV 89408ActiveMLS ID #260012718, Marilou Rotor, eXp Realty. NNRMLS
- $470,0004 bd2 ba1.8k sqft1338 Winnies Ln, Fernley, NV 89408ActiveMLS ID #260011771, Kellie Flodman, Cardin Realty Pros. NNRMLS
- $458,5003 bd2 ba1.7k sqft741 Divot Dr, Fernley, NV 89408ActiveMLS ID #260013019, Joe Reisenauer, Coldwell Banker Select Fernley. NNRMLS
- $489,0003 bd2 ba1.4k sqft1475 Green River Ln, Fernley, NV 89408ActiveMLS ID #260013517, Kinney and Renwick, Chase International-Damonte. NNRMLS
- $315,0003 bd2 ba1.4k sqft350 Vine St, Fernley, NV 89408ActiveMLS ID #260011950, Ellen Lan, All Star Realty. NNRMLS
