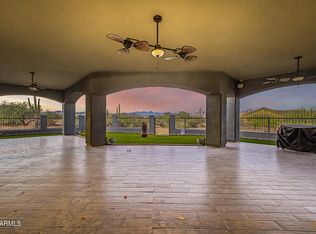
$535,000
4 bd2 ba2.3k sqft
17408 E Windstone Trl, Rio Verde, AZ 85263
Sold

Zillow last checked:
Listing updated:
Mark Hatton 602-743-5929,
Provident Partners Realty,
Patricia Hatton 480-521-5462,
Provident Partners Realty

Not available
Estimated sales range
Not available
Not available
| Date | Event | Price |
|---|---|---|
| 11/6/2026 | Listed for sale | $735,000+2.1%$315/sqft |
Source:  ARMLS #7103390 Report a problem | ||
| 9/30/2026 | Listing removed | $720,000$309/sqft |
Source: ARMLS #7014843 Report a problem | ||
| 7/28/2026 | Price change | $720,000-1.2%$309/sqft |
Source: ARMLS #7014843 Report a problem | ||
| 4/16/2026 | Listed for sale | $729,000+32.5%$313/sqft |
Source: ARMLS #7014843 Report a problem | ||
| 12/30/2024 | Sold | $550,000-3.5%$236/sqft |
Source: ARMLS #6783005 Report a problem | ||
| 11/12/2024 | Listed for sale | $570,000-1.7%$245/sqft |
Source: ARMLS #6783005 Report a problem | ||
| 11/10/2024 | Listing removed | $580,000$249/sqft |
Source: ARMLS #6487563 Report a problem | ||
| 9/4/2024 | Price change | $580,000-3.3%$249/sqft |
Source: ARMLS #6487563 Report a problem | ||
| 8/27/2024 | Price change | $600,000-1.6%$257/sqft |
Source: ARMLS #6487563 Report a problem | ||
| 7/23/2024 | Price change | $610,000-1.6%$262/sqft |
Source: ARMLS #6487563 Report a problem | ||
| 7/3/2024 | Price change | $620,000-1.6%$266/sqft |
Source: ARMLS #6487563 Report a problem | ||
| 6/14/2024 | Price change | $630,000-4.5%$270/sqft |
Source: ARMLS #6487563 Report a problem | ||
| 6/11/2024 | Price change | $660,000-0.8%$283/sqft |
Source: ARMLS #6487563 Report a problem | ||
| 6/6/2024 | Price change | $665,000-0.7%$285/sqft |
Source: ARMLS #6487563 Report a problem | ||
| 5/16/2024 | Price change | $670,000-0.7%$287/sqft |
Source: ARMLS #6487563 Report a problem | ||
| 5/10/2024 | Price change | $675,000-0.7%$290/sqft |
Source: ARMLS #6487563 Report a problem | ||
| 5/1/2024 | Price change | $680,000-1.4%$292/sqft |
Source: ARMLS #6487563 Report a problem | ||
| 4/18/2024 | Price change | $690,000-1.4%$296/sqft |
Source: ARMLS #6487563 Report a problem | ||
| 1/4/2024 | Price change | $699,999-1.4%$300/sqft |
Source: ARMLS #6487563 Report a problem | ||
| 11/2/2023 | Price change | $710,000+1.4%$305/sqft |
Source: ARMLS #6487563 Report a problem | ||
| 10/12/2023 | Listed for sale | $699,999+1.4%$300/sqft |
Source: ARMLS #6487563 Report a problem | ||
| 11/10/2022 | Listed for sale | $689,999$296/sqft |
Source: ARMLS #6487563 Report a problem | ||
| Year | Property taxes | Tax assessment |
|---|---|---|
| 2025 | $1,210 -15.1% | $62,360 -3.3% |
| 2024 | $1,426 +539.9% | $64,470 +1191.5% |
| 2023 | $223 -5.6% | $4,992 -31.4% |
| 2022 | $236 -6.8% | $7,275 +10% |
| 2021 | $253 +2.9% | $6,615 +14.5% |
| 2020 | $246 +3.5% | $5,775 -2% |
| 2019 | $238 | $5,895 +0.3% |
| 2018 | $238 +3.3% | $5,880 -13.5% |
| 2017 | $230 +0% | $6,795 +12.1% |
| 2016 | $230 +7.2% | $6,060 -4.4% |
| 2015 | $215 | $6,336 +79.2% |
| 2014 | -- | $3,536 +13.3% |
| 2013 | -- | $3,120 -7.1% |
| 2012 | -- | $3,360 -50.6% |
| 2011 | -- | $6,800 -63.5% |
| 2010 | -- | $18,640 -34.2% |
| 2009 | -- | $28,342 |
Source: ARMLS. This data may not be complete. We recommend contacting the local school district to confirm school assignments for this home.


A local agent can set up tours, give advice and negotiate with sellers.