This is a Fannie Mae HomePath property. Purchase this property for as little as 3% down! This property is approved for HomePath Mortgage Financing. This property is approved for HomePath Renovation Mortgage Financing. Good neighborhood. Close to Publix and school. For a copy of the Property Condition Report on 18024 Falcon Green Ct, or to speak to a Distressed Property Agent, contact us at info@midfloridahomesforsale.com Weichert Realtors has Distressed Property Experienced agents throughout the state to help Home Shoppers with the Government Owned Home Buying Process. Weichert Realtors is not the listing broker for this 'Government Owned' Property. ALL PROPERTIES ARE SOLD IN 'AS IS' CONDITION. SELLER MAKES NO REPRESENTATIONS OR WARRANTIES CONCERNING THE CONDITION OF THE PROPERTY AND DOES NOT GUARANTEE THAT THE PROPERTY IS FREE OF HIDDEN OR VISIBLE DEFECTS. BUYER IS RESPONSIBLE TO TAKE ACTION TO SATISFY HIMSELF THAT THE PROPERTY IS IN A CONDITION ACCEPTABLE TO HIM. SELLER WILL MAKE NO REPAIRS. BUYER IS ENCOURAGED TO HAVE A HOME INSPECTION TO IDENTIFY ANY DEFECTS. EXIT REALTY CENTRAL
Pre-foreclosure
Est. $493,500
18024 Falcon Green Ct, Orlando, FL 32820
4beds
3baths
3,090sqft
SingleFamily
Built in 2005
6,436 Square Feet Lot
$493,500 Zestimate®
$160/sqft
$42/mo HOA
Overview
- 181 days
- 36
- 0
Facts & features
Interior
Bedrooms & bathrooms
- Bedrooms: 4
- Bathrooms: 3
Heating
- Forced air
Cooling
- Central
Interior area
- Total interior livable area: 3,090 sqft
Property
Parking
- Parking features: Garage
Lot
- Size: 6,436 Square Feet
Details
- Parcel number: 322216152500340
Construction
Type & style
- Home type: SingleFamily
Materials
- masonry
- Roof: Composition
Condition
- Year built: 2005
Community & HOA
HOA
- Has HOA: Yes
- HOA fee: $42 monthly
Location
- Region: Orlando
Financial & listing details
- Price per square foot: $160/sqft
- Tax assessed value: $476,972
- Annual tax amount: $3,389
Foreclosure details
Estimated market value
$493,500
$464,000 - $523,000
$3,020/mo
Price history
| Date | Event | Price |
|---|---|---|
| 11/15/2011 | Sold | $209,000$68/sqft |
Source: Public Record Report a problem | ||
| 10/3/2011 | Price change | $209,000+37.4%$68/sqft |
Source: 100% Real Estate #O5066620 Report a problem | ||
| 9/28/2011 | Listed for sale | -- |
Source: foreclosure.com Report a problem | ||
| 9/9/2011 | Sold | $152,100-57.3%$49/sqft |
Source: Public Record Report a problem | ||
| 7/14/2005 | Sold | $355,800$115/sqft |
Source: Public Record Report a problem | ||
Public tax history
| Year | Property taxes | Tax assessment |
|---|---|---|
| 2024 | $3,389 +7.6% | $221,920 +3% |
| 2023 | $3,149 +4.7% | $215,456 +3% |
| 2022 | $3,009 +2.4% | $209,181 +3% |
| 2021 | $2,937 +0.7% | $203,088 +1.4% |
| 2020 | $2,916 +1.5% | $200,284 +2.3% |
| 2019 | $2,874 +0.9% | $195,781 +1.9% |
| 2018 | $2,849 | $192,131 -25.8% |
| 2017 | $2,849 +1.9% | $258,972 +11.2% |
| 2016 | $2,795 +1.1% | $232,968 +0.6% |
| 2015 | $2,765 -3.1% | $231,485 +7.5% |
| 2014 | $2,853 +1.8% | $215,282 +20.3% |
| 2013 | $2,802 +0.9% | $178,996 +1.8% |
| 2012 | $2,778 -14.7% | $175,902 +6.8% |
| 2011 | $3,257 -3.1% | $164,663 -6.4% |
| 2010 | $3,363 | $175,954 -22.6% |
| 2009 | -- | $227,203 -20.2% |
| 2008 | $4,984 -16.2% | $284,714 -17.8% |
| 2007 | $5,949 +13.3% | $346,557 +24.8% |
| 2006 | $5,252 +393.7% | $277,613 +516.9% |
| 2005 | $1,064 +1903.4% | $45,000 +1451.7% |
| 2004 | $53 | $2,900 |
Find assessor info on the county website
Monthly payment
Climate risks
Neighborhood: 32820
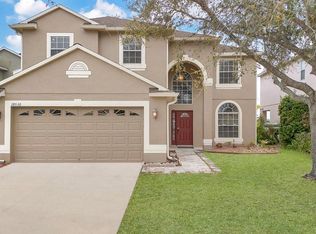

Similar homes
- $--4 bd3 ba2.4k sqft6395 Muller Ave, Cocoa, FL 32927Auction
 Auction.com 2
- $497,5004 bd3 ba2.3k sqft812 JADE FOREST AVENUE, ORLANDO, FL 32828For Sale

 MLS ID #O6430169, Qiping Shen, SMOOTH RIVER REALTY LLC. Stellar MLS
- $489,9003 bd3 ba1.8k sqft16042 RIVER POINTE COURT, ORLANDO, FL 32828For Sale
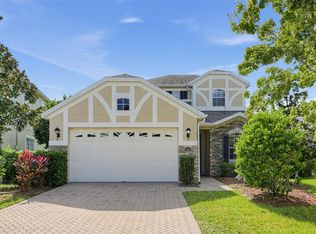 MLS ID #TB8559861, Matias Stofenmacher, EDGESTONE REAL ESTATE, INC.. Stellar MLS
- $535,0004 bd3 ba2.3k sqft609 PRINCE LANE, OVIEDO, FL 32765For Sale
 MLS ID #O6457149, Lilyan Cavalcante Rocha, FORTRESS REAL ESTATE TEAM LLC. Stellar MLS
- $500,0003 bd3 ba2.2k sqft2608 LYNDSCAPE STREET, ORLANDO, FL 32833For SaleMLS ID #O6447173, Carl Van Wesep, CHARLES RUTENBERG REALTY ORLANDO. Stellar MLS
- $539,9003 bd4 ba2.1k sqft1846 KNIGHT AVENUE, ORLANDO, FL 32826For SaleMLS ID #S5158806, Cielo Diaz, REMAX PREMIER PROPERTIES. Stellar MLS
- $449,0004 bd3 ba2.1k sqft9919 CYPRESS KNEE CIRCLE, ORLANDO, FL 32825For SaleMLS ID #R4912230, Fernando Teixeira, WOODSTONE INVESTMENTS LLC. Stellar MLS
- $519,9004 bd3 ba2.1k sqft300 SUN OAKS COURT, LAKE MARY, FL 32746For SaleMLS ID #O6456003, Danay Lay, OLYMPUS EXECUTIVE REALTY INC. Stellar MLS
- $549,0004 bd3 ba2.3k sqft12613 Summer Tree Ct, Orlando, FL 32828For Sale
 MLS ID #1230982, Steven O'Neill, Faustina Trump Real Estate LLC. DBAMLS
- $485,0004 bd3 ba1.9k sqft620 MARTIN AVENUE, ALTAMONTE SPRINGS, FL 32701For SaleMLS ID #O6456905, T J Fairing, A+ REALTY PROFESSIONALS, INC. Stellar MLS
- $469,0005 bd3 ba2.1k sqft4207 ANDOVER CAY BOULEVARD, ORLANDO, FL 32825For SaleMLS ID #O6451891, Jessica Macias, KELLER WILLIAMS ADVANTAGE III. Stellar MLS
- $459,0004 bd2 ba2.1k sqft1009 CORKWOOD DRIVE, OVIEDO, FL 32765For SaleMLS ID #O6453489, Matt White, SLOANE REALTY, LLC. Stellar MLS
- $425,0004 bd2 ba1.8k sqft10336 CEDARHURST AVENUE, ORLANDO, FL 32825For SaleMLS ID #O6455875, Thomas Nestor, III, PA, EXP REALTY LLC. Stellar MLS
- $585,0004 bd3 ba2.8k sqft10319 WILLOW RIDGE LOOP, ORLANDO, FL 32825For SaleMLS ID #O6450086, Leterra Clark, PROSOURCE REALTY INC. Stellar MLS
- $597,0004 bd4 ba3.3k sqft1557 AMARYLLIS CIRCLE, ORLANDO, FL 32825For SaleMLS ID #O6449098, Jenny Wemert, WEMERT GROUP REALTY LLC. Stellar MLS
- $529,0005 bd3 ba2.8k sqft4984 BIRCH STONE LANE, ORLANDO, FL 32829For SaleMLS ID #O6420594, Felicia Velez, VELEZ COURTESY MANAGEMENT. Stellar MLS
- $599,9005 bd5 ba2.8k sqft13538 HIDDEN FOREST CIRCLE, ORLANDO, FL 32828For SaleMLS ID #O6451585, Cesar Ayala, KELLER WILLIAMS ADVANTAGE 2 REALTY. Stellar MLS
- $410,0004 bd2 ba1.9k sqft701 MAGNOLIA CREEK CIRCLE, ORLANDO, FL 32828For SaleMLS ID #O6423356, Karen Albright, OPENDOOR BROKERAGE LLC. Stellar MLS
- $564,0004 bd3 ba2.5k sqft10774 CABBAGE TREE LOOP, ORLANDO, FL 32825For SaleMLS ID #O6446726, David Drawdy, Jr., KELLER WILLIAMS REALTY AT THE PARKS. Stellar MLS
