Flip opportunity now available!
Rehab: $15K–$20K to get it rent ready
ARV: $180k
Central AC + Furnace
Vacant
Light cosmetic rehab: debris/cleanout, damaged flooring repair, hardwood refinish, paint/touch-ups, bath/kitchen cleanup, utility-area repairs, HVAC service.
Exterior needs significant lawn/vegetation cleanup, mowing, trimming + clearing growth around AC condenser.
Strong BRRRR / LTR / Section 8 / RBR / flip potential.
Please call/text to get additional photos, details and to schedule a walk-thru.
Amanda: 317-760-3254
Jamie: 317-610-9834
For sale by owner
$115,000
1813 Asbury St, Indianapolis, IN 46203
3beds
1,008sqft
SingleFamily
Built in 1949
4,791 Square Feet Lot
$-- Zestimate®
$114/sqft
$-- HOA
Overview
- 44 days
- 906
- 88
Listed by:
Property Owner (317) 760-3254
Facts & features
Interior
Bedrooms & bathrooms
- Bedrooms: 3
- Bathrooms: 1
- Full bathrooms: 1
Heating
- Other
Cooling
- Central
Appliances
- Included: Range / Oven, Refrigerator
Features
- Flooring: Hardwood, Linoleum / Vinyl
- Basement: None
Interior area
- Total interior livable area: 1,008 sqft
Property
Features
- Exterior features: Vinyl
Lot
- Size: 4,791 Square Feet
Details
- Parcel number: 491018157016000101
Construction
Type & style
- Home type: SingleFamily
- Architectural style: Bungalow
Materials
- Frame
- Foundation: Crawl/Raised
- Roof: Asphalt
Condition
- New construction: No
- Year built: 1949
Community & HOA
Location
- Region: Indianapolis
Financial & listing details
- Price per square foot: $114/sqft
- Tax assessed value: $77,000
- Annual tax amount: $1,642
- Date on market: 9/8/2026
Estimated market value
Not available
Estimated sales range
Not available
$1,204/mo
Price history
| Date | Event | Price |
|---|---|---|
| 9/8/2026 | Listed for sale | $115,000+130%$114/sqft |
Source: Owner Report a problem | ||
| 2/11/2022 | Sold | $50,000$50/sqft |
Source: Public Record Report a problem | ||
| 7/20/2018 | Sold | $50,000-19.4%$50/sqft |
Source:  MIBOR as distributed by MLS GRID #21577350 Report a problem | ||
| 7/5/2018 | Pending sale | $62,000$62/sqft |
Source: Alpine Realty, LLC #21577350 Report a problem | ||
| 6/28/2018 | Listed for sale | $62,000+785.7%$62/sqft |
Source: Alpine Realty, LLC #21577350 Report a problem | ||
| 8/4/2017 | Listing removed | $675$1/sqft |
Source: Alpine Leasing, LLC Report a problem | ||
| 7/25/2017 | Listed for rent | $675$1/sqft |
Source: Alpine Leasing, LLC Report a problem | ||
| 2/18/2016 | Listing removed | $675$1/sqft |
Source: Zillow Rental Network Report a problem | ||
| 1/8/2016 | Sold | $7,000-70.8%$7/sqft |
Source: Public Record Report a problem | ||
| 1/2/2016 | Listed for rent | $675-10%$1/sqft |
Source: Zillow Rental Network Report a problem | ||
| 10/11/2014 | Listing removed | $24,000$24/sqft |
Source: RE/MAX Legends Group #21188672 Report a problem | ||
| 11/26/2013 | Price change | $24,000+29%$24/sqft |
Source: RE/MAX Legends Group #21188672 Report a problem | ||
| 4/5/2013 | Price change | $18,600-43.6%$18/sqft |
Source: RE/MAX Legends Group #21188672 Report a problem | ||
| 3/15/2013 | Price change | $33,000-23.3%$33/sqft |
Source: RE/MAX Legends Group #21188672 Report a problem | ||
| 12/5/2012 | Price change | $43,000-17.3%$43/sqft |
Source: RE/MAX Legends Group #21188672 Report a problem | ||
| 10/11/2012 | Price change | $52,000-3.7%$52/sqft |
Source: RE/MAX Legends Group #21188672 Report a problem | ||
| 8/28/2012 | Listed for sale | $54,000$54/sqft |
Source: RE/MAX Legends Group #21188672 Report a problem | ||
| 8/28/2012 | Listing removed | $750$1/sqft |
Source: RPM Central Indiana Report a problem | ||
| 5/15/2012 | Price change | $750+20%$1/sqft |
Source: RPM Central Indiana Report a problem | ||
| 3/9/2012 | Listed for rent | $625$1/sqft |
Source: Rentbits Report a problem | ||
Public tax history
| Year | Property taxes | Tax assessment |
|---|---|---|
| 2025 | $1,642 +4.3% | $77,000 +11.3% |
| 2024 | $1,575 -12.2% | $69,200 +4.2% |
| 2023 | $1,794 +19.8% | $66,400 -12.6% |
| 2022 | $1,497 +11.5% | $76,000 +17.1% |
| 2021 | $1,343 +18.3% | $64,900 +11.9% |
| 2020 | $1,136 +47.1% | $58,000 +20.6% |
| 2019 | $772 +10.1% | $48,100 +48.5% |
| 2018 | $701 +3.7% | $32,400 +2.9% |
| 2017 | $676 +12% | $31,500 +6.4% |
| 2016 | $603 -8.2% | $29,600 -2.6% |
| 2014 | $657 -3.3% | $30,400 +6.3% |
| 2013 | $680 | $28,600 -5.6% |
| 2012 | $680 | $30,300 +1.3% |
| 2011 | -- | $29,900 |
| 2010 | $622 -2.5% | $29,900 |
| 2009 | $637 | $29,900 -11% |
| 2007 | -- | $33,600 +9.4% |
| 2005 | -- | $30,700 |
| 2004 | -- | $30,700 |
| 2003 | -- | $30,700 +100.7% |
| 2002 | -- | $15,300 +186.5% |
| 2001 | -- | $5,340 |
| 2000 | -- | $5,340 |
Find assessor info on the county website
Monthly payment
Est. payment
Payment breakdown
Explore the cost of this home by adjusting the details. Changes won't be saved.Climate risks
Neighborhood: Near Southeast
Nearby schools
Schools provided by the listing agent
- District: Indianapolis Public Schools
Source: The MLS. This data may not be complete. We recommend contacting the local school district to confirm school assignments for this home.


Similar homes
- $129,9002 bd1 ba952 sqft2329 Harlan St, Indianapolis, IN 46203Active
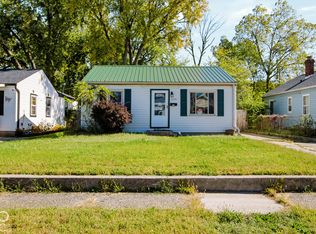 MLS ID #22132238, P. Aaron Starr, F.C. Tucker Company. MIBOR as distributed by MLS GRID
- $109,0002 bd1 ba793 sqft3909 Prospect St, Indianapolis, IN 46203Active
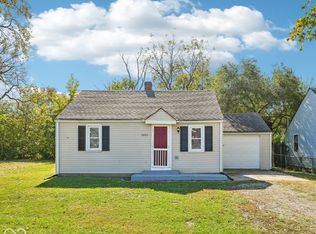 MLS ID #22132091, Patricia McCormick, Trueblood Real Estate. MIBOR as distributed by MLS GRID
- $119,0003 bd1 ba1.1k sqft2594 Saint Paul St, Indianapolis, IN 46203Active
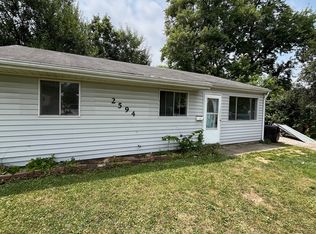 MLS ID #22116878, Amanda Bick, Keller Williams Indy Metro NE. MIBOR as distributed by MLS GRID
- $124,9002 bd1 ba1k sqft4339 Spann Ave, Indianapolis, IN 46203Active
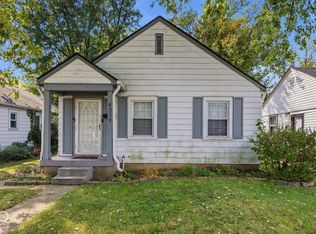 MLS ID #22132247, Nathaniel Cromlich, CENTURY 21 Scheetz. MIBOR as distributed by MLS GRID
