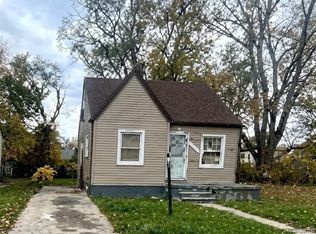
Welcome to 18671 Conley Street! This beautifully updated 2-bedroom, 1-bathroom home offers a fresh, modern feel with renovations completed in 2026. The fully finished main floor features vinyl flooring throughout, a brand-new kitchen, and a completely renovated bathroom. With a clean, move-in-ready interior and a basement offering additional space and potential, this home is perfect for homeowners and investors alike. Schedule your showing today!
For sale
$69,777
18671 Conley St, Detroit, MI 48234
2beds
1,344sqft
Single Family Residence
Built in 1950
3,484 Square Feet Lot
$-- Zestimate®
$52/sqft
$-- HOA
What's special
- 37 days
- 121
- 19
Zillow last checked:
Listing updated:
Listed by:
Lama Mohieddine 313-228-5710,
Got Key'D Realty 313-228-5710
Source: Realcomp II,MLS#: 20261081569
Facts & features
Interior
Bedrooms & bathrooms
- Bedrooms: 2
- Bathrooms: 1
- Full bathrooms: 1
Bedroom
- Level: Entry
- Area: 88
- Dimensions: 11 X 8
Bedroom
- Level: Entry
- Area: 132
- Dimensions: 11 X 12
Other
- Level: Entry
- Area: 28
- Dimensions: 7 X 4
Heating
- Forced Air, Natural Gas
Features
- Basement: Partially Finished
- Has fireplace: No
Interior area
- Total interior livable area: 1,344 sqft
- Finished area above ground: 672
- Finished area below ground: 672
Property
Parking
- Parking features: No Garage
Features
- Levels: One
- Stories: 1
- Entry location: GroundLevelwSteps
- Pool features: None
Lot
- Size: 3,484 Square Feet
- Dimensions: 35 x 105
Details
- Parcel number: W13I016781S
- Special conditions: Short Sale No,Standard
Construction
Type & style
- Home type: SingleFamily
- Architectural style: Ranch
- Property subtype: Single Family Residence
Materials
- Wood Siding
- Foundation: Basement, Block
Condition
- New construction: No
- Year built: 1950
Utilities & green energy
- Sewer: Public Sewer
- Water: Public
Community & HOA
Community
- Subdivision: HARRAHS NORWOOD SUB
HOA
- Has HOA: No
Location
- Region: Detroit
Financial & listing details
- Price per square foot: $52/sqft
- Tax assessed value: $5,670
- Annual tax amount: $1,445
- Date on market: 10/8/2026
- Cumulative days on market: 38 days
- Listing agreement: Exclusive Right To Sell
- Listing terms: Cash,Conventional,FHA
- Exclusions: Exclusion(s) Do Not Exist
Estimated market value
Not available
Estimated sales range
Not available
$987/mo
Price history
| Date | Event | Price |
|---|---|---|
| 10/8/2026 | Listed for sale | $69,777+248.9%$52/sqft |
Source:  Realcomp II #20261081569 Report a problem | ||
| 8/12/2026 | Sold | $20,000-60%$15/sqft |
Source: Public Record Report a problem | ||
| 8/15/2025 | Listing removed | $50,000$37/sqft |
Source: Realcomp II #20250011294 Report a problem | ||
| 5/29/2025 | Price change | $50,000-9.1%$37/sqft |
Source: Realcomp II #20250011294 Report a problem | ||
| 4/11/2025 | Price change | $55,000-8.3%$41/sqft |
Source: Realcomp II #20250011294 Report a problem | ||
| 2/20/2025 | Listed for sale | $60,000+0.2%$45/sqft |
Source: Realcomp II #20250011294 Report a problem | ||
| 1/21/2025 | Listing removed | $59,900$45/sqft |
Source: Realcomp II #20240090103 Report a problem | ||
| 12/4/2024 | Listed for sale | $59,900+39.3%$45/sqft |
Source: Realcomp II #20240090103 Report a problem | ||
| 8/15/2024 | Listing removed | -- |
Source: Realcomp II #20240043843 Report a problem | ||
| 7/22/2024 | Price change | $43,000-12.2%$32/sqft |
Source: Realcomp II #20240043843 Report a problem | ||
| 6/20/2024 | Listed for sale | $49,000+4.3%$36/sqft |
Source: Realcomp II #20240043843 Report a problem | ||
| 3/14/2024 | Listing removed | -- |
Source: Zillow Rentals Report a problem | ||
| 10/9/2023 | Price change | $900-5.3%$1/sqft |
Source: Zillow Rentals Report a problem | ||
| 8/7/2023 | Listed for rent | $950$1/sqft |
Source: Zillow Rentals Report a problem | ||
| 10/4/2021 | Sold | $47,000+213.3%$35/sqft |
Source: Public Record Report a problem | ||
| 7/12/2021 | Sold | $15,000+200%$11/sqft |
Source: Public Record Report a problem | ||
| 1/14/2019 | Sold | $5,000-9.1%$4/sqft |
Source: Public Record Report a problem | ||
| 12/12/2018 | Listed for sale | $5,500$4/sqft |
Source: Bynum Ward & Associates #218116765 Report a problem | ||
Public tax history
| Year | Property taxes | Tax assessment |
|---|---|---|
| 2026 | -- | $6,400 -12.3% |
| 2025 | -- | $7,300 +43.1% |
| 2024 | -- | $5,100 +2% |
| 2023 | -- | $5,000 +35.1% |
| 2022 | -- | $3,700 +5.7% |
| 2021 | -- | $3,500 |
| 2020 | $808 +88.7% | $3,500 +17.8% |
| 2019 | $428 | $2,970 +2.4% |
| 2018 | $428 | $2,900 +7.4% |
| 2017 | -- | $2,700 -81.6% |
| 2016 | $578 | $14,700 +93.4% |
| 2015 | $578 -28.4% | $7,600 -19.8% |
| 2013 | $807 +39.6% | $9,482 -31.8% |
| 2010 | $578 | $13,902 -12% |
| 2009 | -- | $15,798 -13.5% |
| 2008 | -- | $18,264 |
| 2007 | -- | $18,264 +5.5% |
| 2005 | $81 | $17,312 +3% |
| 2004 | -- | $16,808 +178.5% |
| 2001 | $393 +12.2% | $6,036 +3.2% |
| 2000 | $350 | $5,849 |
Find assessor info on the county website
Monthly payment
Est. payment
Payment breakdown
Explore the cost of this home by adjusting the details. Changes won't be saved.Climate risks
Neighborhood: Krainz Woods


Similar homes
- $75,0003 bd2 ba1.1k sqft19249 Eureka St, Detroit, MI 48234For Sale

 MLS ID #20261064216, Antwuan M Hawkins, Five Star Luxury Realty. Realcomp II
- $85,0003 bd2 ba768 sqft18822 Buffalo St, Detroit, MI 48234For Sale
 MLS ID #20261084852, Danielle S Dunham, EXP Realty Main. Realcomp II
- $74,0003 bd2 ba1k sqft17327 Teppert St, Detroit, MI 48234For Sale
 MLS ID #20261077460, Ian Breck, Clyde Realty LLC. Realcomp II
- $70,0002 bd1 ba772 sqft18937 Algonac St, Detroit, MI 48234For Sale
 MLS ID #20261082565, Ryan Lonsway, Good Company. Realcomp II
- $79,9002 bd1 ba800 sqft19327 Sunset St, Detroit, MI 48234For SaleMLS ID #20261068284, Future D Davis, EXP Realty Main. Realcomp II
- $69,9003 bd1 ba1.3k sqft13925 Cherrylawn St, Detroit, MI 48238For SaleMLS ID #20261090827, Liliana Gjetaj, Thrive Realty Company. Realcomp II
- $85,0002 bd1 ba819 sqft19707 Concord St, Detroit, MI 48234For SaleMLS ID #20261072341, Monique Burns, Great Day Realty, LLC. Realcomp II
- $64,9993 bd2 ba1.2k sqft11767 Engleside St, Detroit, MI 48205For SaleMLS ID #20261081277, Wilkin Lai, Premier Agent Network Michigan LLC. Realcomp II
- $75,0003 bd1 ba1k sqft17167 Lumpkin St, Hamtramck, MI 48212For SaleMLS ID #20261084883, Ligia M Godoy, CMB Real Estate. Realcomp II
- $70,0002 bd1 ba696 sqft13971 Hobart Ave, Warren, MI 48089For Sale
 MLS ID #50226385, Chandler Nash, Realteam Real Estate. MiRealSource
- $69,9003 bd2 ba1.1k sqft18096 Joann St, Detroit, MI 48205For SaleMLS ID #20251048392, Jermaine Golden, REMAX City Centre. Realcomp II
- $85,0002 bd1 ba1.6k sqft15663 Carlisle St, Detroit, MI 48205For SaleMLS ID #20261091955, Hassan Hammoud, U.S. Investor Group. Realcomp II
- $69,0002 bd1 ba978 sqft20707 Moross Rd, Detroit, MI 48224For SaleMLS ID #20261072221, Bashar G Nijem, Realtyflo Inc. Realcomp II
- $70,0002 bd2 ba755 sqft14981 Flanders St, Detroit, MI 48205For SaleMLS ID #20261060326, Damian Hickman, EXP Realty Main. Realcomp II
- $90,0003 bd1 ba1.7k sqft20192 Goddard St, Detroit, MI 48234For SaleMLS ID #20261060931, Future D Davis, EXP Realty Main. Realcomp II
- $79,9993 bd2 ba1.9k sqft14473 Carlisle St, Detroit, MI 48205For SaleMLS ID #20261088464, Demontay Scott, EXP Z Real Estate. Realcomp II
- $69,0002 bd1 ba794 sqft18485 Prevost St, Detroit, MI 48235For SaleMLS ID #20261063471, Gentraia Brown, REMAX City Centre. Realcomp II
- $85,0002 bd1 ba744 sqft11454 Saint Patrick St, Detroit, MI 48205For Sale
 MLS ID #26056674, Courtney Thompson, KW Advantage. MichRIC
- $60,0002 bd1 ba768 sqft19143 Keating St, Highland Park, MI 48203For SaleMLS ID #20261076536, Lashawn Peterson, EXP Realty Main. Realcomp II
- $65,0003 bd1 ba1k sqft7413 Elmhurst St, Detroit, MI 48204For SaleMLS ID #20261080113, Jamal Kabbani, Keller Williams Legacy. Realcomp II
