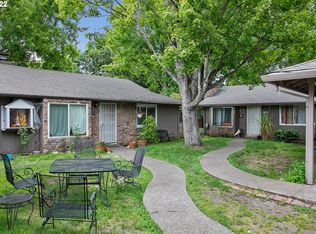
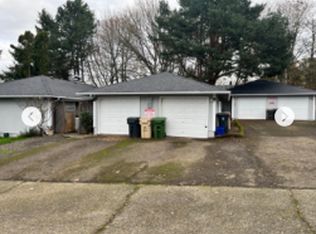
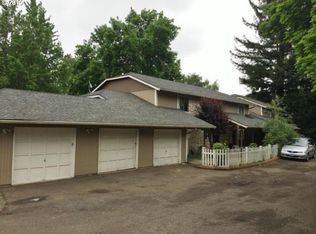
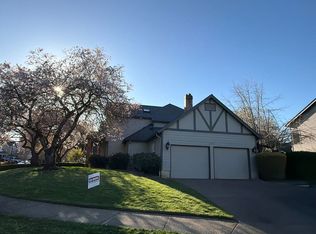
This 3726 square foot single family home has 4 bedrooms and 2.0 bathrooms. This home is located at 19738 SW 67th Ave, Tualatin, OR 97062.
Pre-foreclosure
Street View
Est. $966,700
19738 SW 67th Ave, Tualatin, OR 97062
4beds
2baths
3,726sqft
SingleFamily
Built in 1978
0.32 Acres Lot
$966,700 Zestimate®
$259/sqft
$-- HOA
Overview
- 74 days |
- 15 |
- 0 |
Facts & features
Interior
Bedrooms & bathrooms
- Bedrooms: 4
- Bathrooms: 2
Heating
- Forced air
Features
- Has fireplace: Yes
Interior area
- Total interior livable area: 3,726 sqft
Property
Parking
- Parking features: Garage
Features
- Exterior features: Wood, Wood products
Lot
- Size: 0.32 Acres
Details
- Parcel number: 2S124DD01800
Construction
Type & style
- Home type: SingleFamily
Materials
- wood frame
- Roof: Shake / Shingle
Condition
- Year built: 1978
Community & HOA
Location
- Region: Tualatin
Financial & listing details
- Price per square foot: $259/sqft
- Tax assessed value: $960,900
- Annual tax amount: $9,019
Visit our professional directory to find a foreclosure specialist in your area that can help with your home search.
Find a foreclosure agentForeclosure details
Estimated market value
$966,700
$909,000 - $1.03M
$3,548/mo
Price history
| Date | Event | Price |
|---|---|---|
| 8/10/2022 | Sold | $875,000+133.4%$235/sqft |
Source: Public Record Report a problem | ||
| 1/26/2006 | Sold | $374,900+16.4%$101/sqft |
Source: Public Record Report a problem | ||
| 4/28/2005 | Sold | $322,200$86/sqft |
Source: Public Record Report a problem | ||
Public tax history
| Year | Property taxes | Tax assessment |
|---|---|---|
| 2025 | $9,019 +10.1% | $481,800 +3% |
| 2024 | $8,195 +2.7% | $467,770 +3% |
| 2023 | $7,980 +4.5% | $454,150 +3% |
| 2022 | $7,635 +2.5% | $440,930 |
| 2021 | $7,449 +3.1% | -- |
| 2020 | $7,228 +2.8% | $415,630 +3% |
| 2019 | $7,034 +4.2% | $403,530 |
| 2018 | $6,748 | $403,530 +6.1% |
| 2017 | $6,748 +14.3% | $380,370 +3% |
| 2016 | $5,903 | $369,300 +3% |
| 2015 | $5,903 +8.5% | $358,550 +3% |
| 2014 | $5,441 +11.4% | $348,110 +6.3% |
| 2013 | $4,886 +13.2% | $327,550 +12.4% |
| 2012 | $4,315 -13.7% | $291,330 -14.1% |
| 2011 | $4,997 -0.4% | $339,080 -6.1% |
| 2010 | $5,017 -4.1% | $361,070 -16% |
| 2009 | $5,233 +4.4% | $430,050 +3.3% |
| 2008 | $5,010 +2.2% | $416,120 -10% |
| 2007 | $4,903 +8.5% | $462,520 +19.2% |
| 2006 | $4,519 -1% | $387,930 +13.1% |
| 2005 | $4,567 +3.9% | $342,920 -6% |
| 2004 | $4,395 +2.1% | $364,850 +4.2% |
| 2003 | $4,304 +2.9% | $350,080 +10.7% |
| 2002 | $4,183 +5.6% | $316,120 -1.1% |
| 2001 | $3,960 +5.8% | $319,760 +0.7% |
| 2000 | $3,743 | $317,580 |
Find assessor info on the county website
Monthly payment
Estimated monthly payment$1,822
All calculations are estimates and provided by Zillow, Inc. for informational purposes only. Actual amounts may vary.
HOA fees may include property taxes on listings classified as Co-Ops. Contact the listing agent and/or owner for fee details.
Mortgage interest rates are dependent on a number of factors, including credit score, down payment, and repayment length. Interest rate data provided by Zillow Group Marketplace, Inc. as of 1/1/1970 from various mortgage lenders with which we have lead or other similar arrangements; the Estimated Payment is an average of those rates.
See how much you could borrow to make a competitive offer.
Climate risks
Neighborhood: 97062
Nearby schools
GreatSchools rating
- 6/10Bridgeport Elementary SchoolGrades: K-5Distance: 0.7 mi
- 3/10Hazelbrook Middle SchoolGrades: 6-8Distance: 2.5 mi
- 4/10Tualatin High SchoolGrades: 9-12Distance: 1.7 mi


- Oregon
- Washington County
- Tualatin
- 97062
- 19738 SW 67th Ave
Nearby cities
Nearby zip codes
Other Tualatin Topics
