Calling all flippers and investors!! Solid Lancaster City opportunity at 213 N Marshall. 3-bedroom, 1-bathroom home with real upside for the right buyer. Convenient location with easy access to downtown. Great value add opportunity and a perfect project for a flip or long-term rental once you put your plan in place. This property is being sold as-is. Buyer to perform their own due diligence.
For sale
$169,999
213 N Marshall St, Lancaster, PA 17602
3beds
1,480sqft
Townhouse
Built in 1890
1,307 Square Feet Lot
$166,900 Zestimate®
$115/sqft
$-- HOA
What's special
- 12 days
- 773
- 44
Likely to sell faster than
Zillow last checked:
Listing updated:
Listed by:
Noah Barger 717-203-8143,
JRHeller.com LLC 7178036446
Source: Bright MLS,MLS#: PALA2098166
Facts & features
Interior
Bedrooms & bathrooms
- Bedrooms: 3
- Bathrooms: 1
- Full bathrooms: 1
Basement
- Area: 0
Heating
- Forced Air, Natural Gas
Cooling
- None
Appliances
- Included: Water Heater
Features
- Basement: Unfinished
- Has fireplace: No
Interior area
- Total structure area: 1,480
- Total interior livable area: 1,480 sqft
- Finished area above ground: 1,480
- Finished area below ground: 0
Property
Parking
- Parking features: On Street
- Has uncovered spaces: Yes
Accessibility
- Accessibility features: None
Features
- Levels: Three
- Stories: 3
- Pool features: None
Lot
- Size: 1,307 Square Feet
Details
- Additional structures: Above Grade, Below Grade
- Parcel number: 3362511900000
- Zoning: RESIDENTIAL
- Special conditions: Standard
Construction
Type & style
- Home type: Townhouse
- Architectural style: Other
- Property subtype: Townhouse
Materials
- Brick
- Foundation: Brick/Mortar
Condition
- New construction: No
- Year built: 1890
Utilities & green energy
- Sewer: Public Sewer
- Water: Public
Community & HOA
Community
- Subdivision: East End Lancaster
HOA
- Has HOA: No
Location
- Region: Lancaster
- Municipality: LANCASTER CITY
Financial & listing details
- Price per square foot: $115/sqft
- Tax assessed value: $82,100
- Annual tax amount: $3,491
- Date on market: 10/31/2026
- Listing agreement: Exclusive Agency
- Ownership: Fee Simple
Estimated market value
$166,900
$159,000 - $175,000
$1,689/mo
Price history
| Date | Event | Price |
|---|---|---|
| 10/31/2026 | Listed for sale | $169,999+27.3%$115/sqft |
Source:  Bright MLS #PALA2098166 Report a problem | ||
| 10/23/2026 | Sold | $133,500+76.8%$90/sqft |
Source: Public Record Report a problem | ||
| 9/30/2011 | Sold | $75,500$51/sqft |
Source: Public Record Report a problem | ||
| 8/21/2011 | Price change | $75,500+3.4%$51/sqft |
Source: Coldwell Banker Select Professionals #176357 Report a problem | ||
| 8/14/2011 | Price change | $73,000-5.2%$49/sqft |
Source: Select Professionals #176357 Report a problem | ||
| 7/26/2011 | Price change | $77,000-6.1%$52/sqft |
Source: Select Professionals #176357 Report a problem | ||
| 7/8/2011 | Price change | $82,000-5.7%$55/sqft |
Source: Select Professionals #176357 Report a problem | ||
| 3/17/2011 | Listed for sale | $87,000$59/sqft |
Source: Vflyer #176357 Report a problem | ||
| 8/28/2007 | Sold | $87,000+74%$59/sqft |
Source: Public Record Report a problem | ||
| 5/25/2007 | Sold | $50,000+92.3%$34/sqft |
Source: Public Record Report a problem | ||
| 9/5/2001 | Sold | $26,000+1054.5%$18/sqft |
Source: Public Record Report a problem | ||
| 12/15/2000 | Sold | $2,252$2/sqft |
Source: Public Record Report a problem | ||
Public tax history
| Year | Property taxes | Tax assessment |
|---|---|---|
| 2026 | $3,392 +3.3% | $82,100 |
| 2025 | $3,283 +1.1% | $82,100 |
| 2024 | $3,249 +1.7% | $82,100 |
| 2023 | $3,194 +4.3% | $82,100 |
| 2022 | $3,061 | $82,100 |
| 2021 | $3,061 +1180.8% | $82,100 |
| 2020 | $239 -91.9% | $82,100 |
| 2019 | $2,951 +1134.6% | $82,100 |
| 2018 | $239 -91.6% | $82,100 +32.8% |
| 2017 | $2,839 +0.9% | $61,800 |
| 2016 | $2,813 +38.7% | $61,800 |
| 2015 | $2,027 | $61,800 |
| 2014 | $2,027 | $61,800 |
| 2013 | -- | $61,800 |
| 2012 | -- | $61,800 |
| 2011 | -- | $61,800 |
| 2010 | -- | $61,800 |
| 2009 | -- | $61,800 |
| 2007 | -- | $61,800 |
| 2006 | -- | $61,800 |
| 2005 | -- | $61,800 +4.2% |
| 2004 | -- | $59,300 |
| 2003 | -- | $59,300 |
| 2002 | -- | $59,300 |
| 2000 | -- | $59,300 |
Find assessor info on the county website
Monthly payment
Est. payment
Payment breakdown
Explore the cost of this home by adjusting the details. Changes won't be saved.Climate risks
Neighborhood: East Side
Nearby schools
Schools provided by the listing agent
- District: School District Of Lancaster
Source: Bright MLS. This data may not be complete. We recommend contacting the local school district to confirm school assignments for this home.
Similar homes
- $190,0003 bd1 ba1.7k sqft612 N Marshall St, Lancaster, PA 17602For Sale
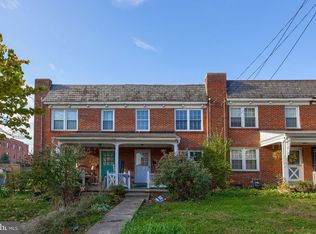
 MLS ID #PALA2097902, Timothy Shreiner, Berkshire Hathaway HomeServices Homesale Realty. Bright MLS
- $154,9003 bd1 ba971 sqft539 1/2 Green St, Lancaster, PA 17602For Sale
 MLS ID #PALA2097970, Jake Beiler, Hostetter Realty LLC. Bright MLS
- $235,0003 bd2 ba1.3k sqft532 North St, Lancaster, PA 17602For Sale
 MLS ID #PALA2098658, Christian Will, Keller Williams Elite. Bright MLS
- $199,0003 bd1 ba1.3k sqft540 Manor St, Lancaster, PA 17603For Sale
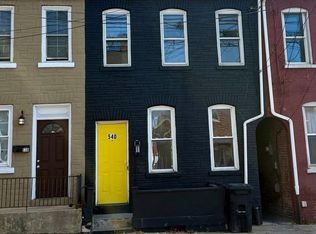 MLS ID #PALA2098076, Ben Esh, Astoria Realty Advisors LLC. Bright MLS
- $150,0003 bd2 ba1.2k sqft603 E Marion St, Lancaster, PA 17602AuctionMLS ID #PALA2093386, David Nguyen, Cavalry Realty, LLC. Bright MLS
- $199,9003 bd1 ba1.2k sqft540 Green St, Lancaster, PA 17602For SaleMLS ID #PALA2094914, Jeffrey Zimmerman, Prime Home Real Estate, LLC. Bright MLS
- $239,5004 bd2 ba1.7k sqft1030 Willow Street Pike, Lancaster, PA 17602For SaleMLS ID #PALA2097776, Christian Will, Keller Williams Elite. Bright MLS
- $165,0003 bd1 ba850 sqft615 High St, Lancaster, PA 17603For SaleMLS ID #PALA2092696, Zuleica Vazquez, Home 1st Realty. Bright MLS
- $179,9004 bd1 ba1.1k sqft623 Bay St, Lancaster, PA 17603For SaleMLS ID #PALA2092716, Lee Wolff, FSBO Broker. Bright MLS
- $222,0003 bd1 ba1.2k sqft829 5th St, Lancaster, PA 17603For SaleMLS ID #PALA2098610, Kyle Ebersole, Keller Williams Elite. Bright MLS
- $247,0003 bd2 ba1k sqft30 W Strawberry St, Lancaster, PA 17603For SaleMLS ID #PALA2098410, Corey Ayres, Lusk & Associates Sotheby's International Realty. Bright MLS
- $249,9003 bd2 ba1.1k sqft364 E Liberty St, Lancaster, PA 17602For SaleMLS ID #PALA2098518, Christian Will, Keller Williams Elite. Bright MLS
- $174,9002 bd1 ba1k sqft674 Saint Joseph St, Lancaster, PA 17603For SaleMLS ID #PALA2092416, Anthony Santiago, Keller Williams Elite. Bright MLS
- $218,0003 bd1 ba1.4k sqft349 N Concord St, Lancaster, PA 17603For SaleMLS ID #PALA2096712, Debra Burke, Keller Williams Elite. Bright MLS
- $229,9004 bd1 ba1.9k sqft441 E Strawberry St, Lancaster, PA 17602For SaleMLS ID #PALA2090218, Lauren Blain, RE/MAX SmartHub Realty. Bright MLS
- $239,9004 bd2 ba1.6k sqft311 S Queen St, Lancaster, PA 17603For SaleMLS ID #PALA2096960, Nikki Macias, Cavalry Realty LLC. Bright MLS
- $149,9994 bd2 ba1.5k sqft931 W Fairway Dr, Lancaster, PA 17603AuctionMLS ID #PALA2097808, Kevin Snyder, RE/MAX Of Reading. Bright MLS
- $247,0002 bd1 ba1k sqftEmra-tom,717-291-5938, Lancaster, PA 17602For SaleMLS ID #PALA2098218, Ben Esh, Astoria Realty Advisors LLC. Bright MLS
